Advanced Monitoring
Take advantage of advanced functions such as monitoring predicted values,monitoring values calculated from multiple metrics,and using machine learning to detect anomalies that deviate from past trends.Flexibly configure threshold values, error detection settings,and maintenance period downtime settings.
Expression Monitoring
Monitor metrics calculated by expressions
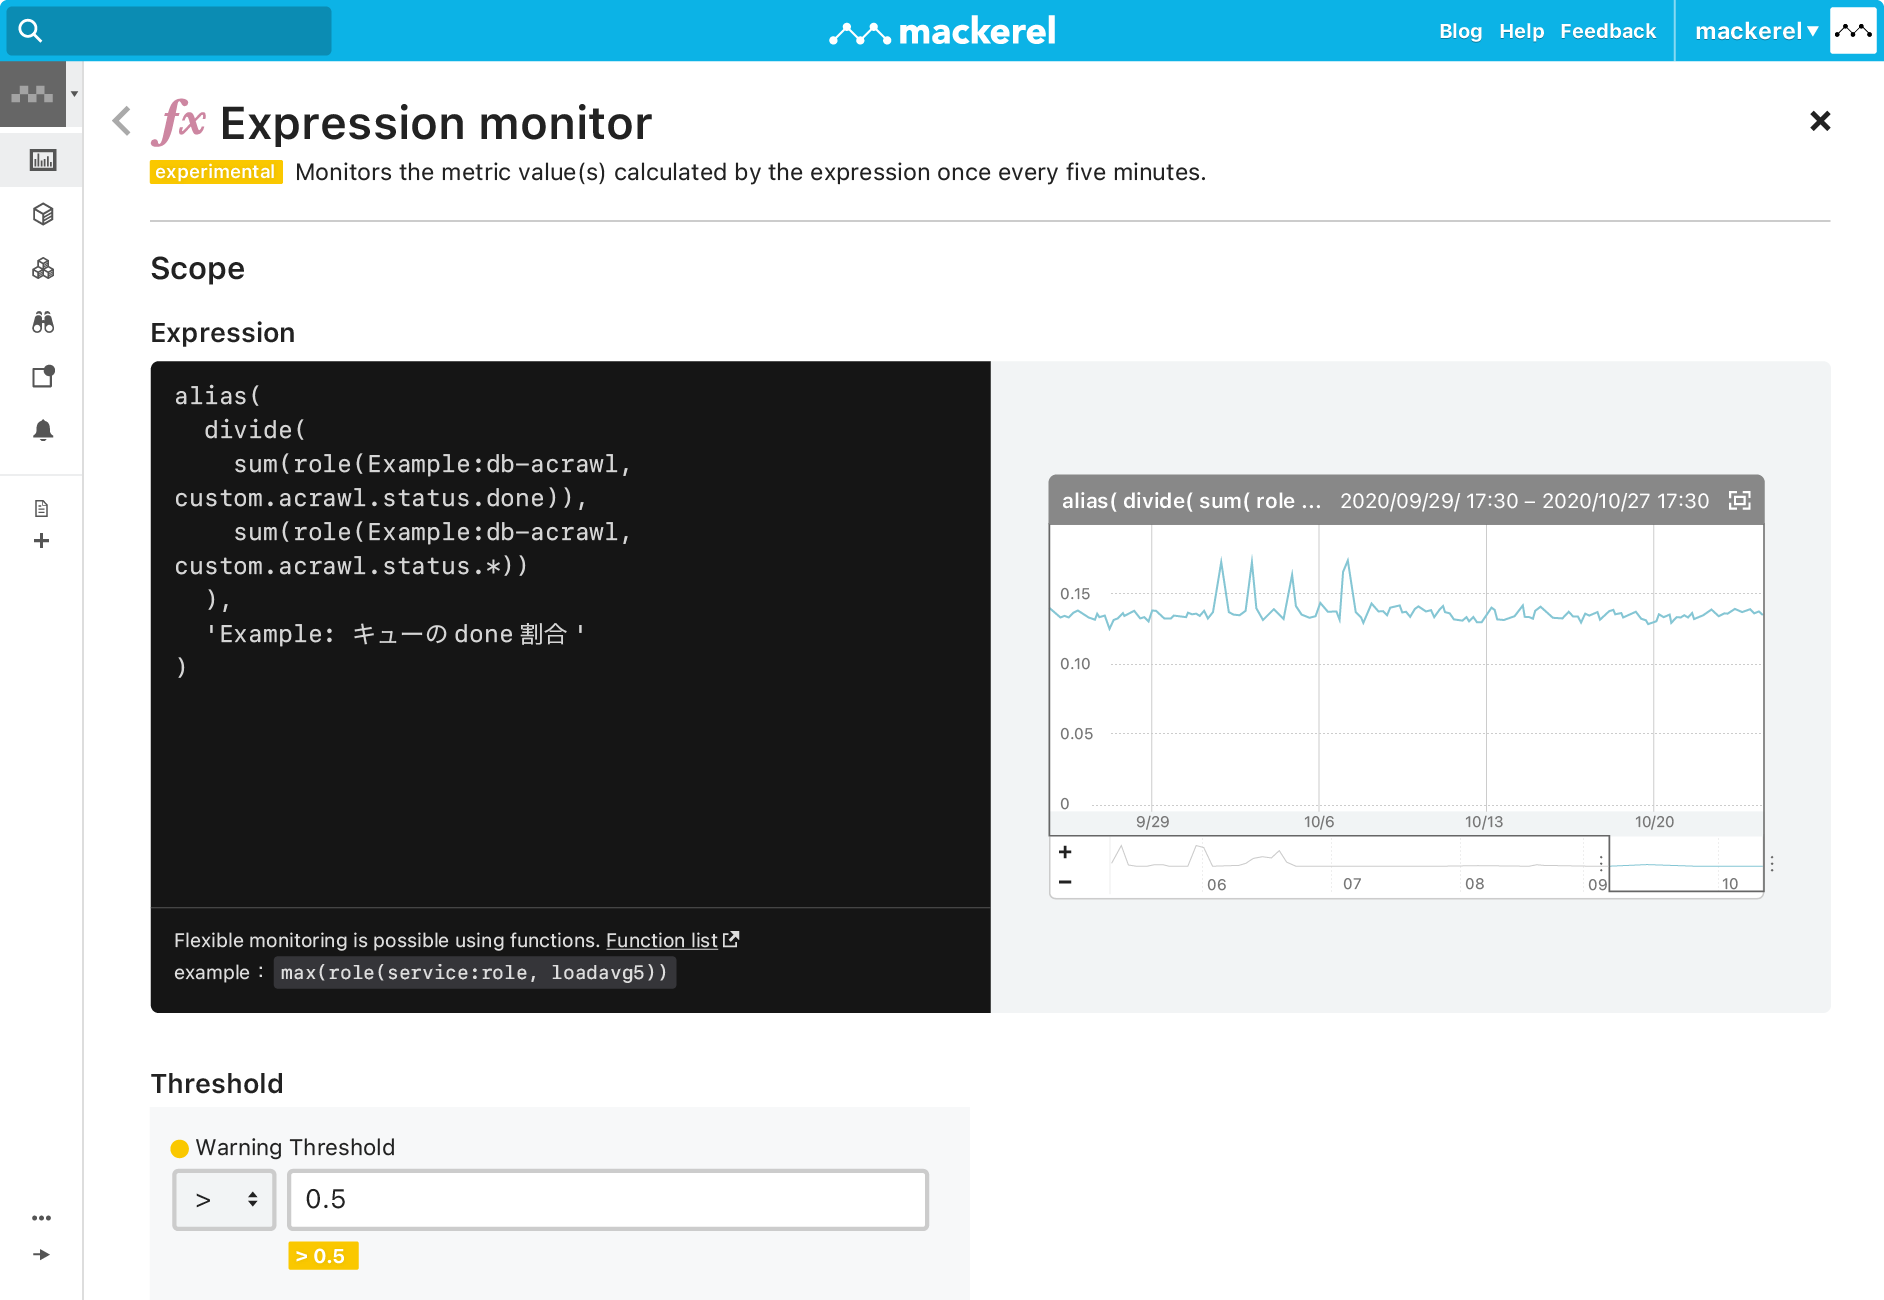
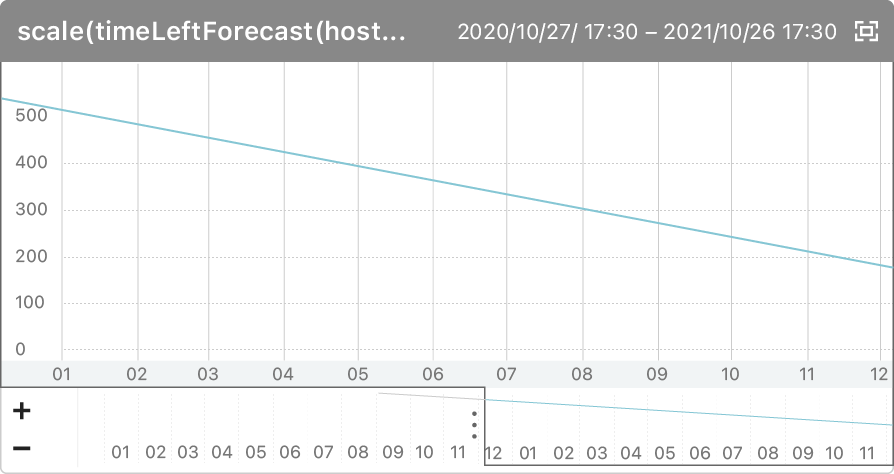
Draw up unique graphs using function-based expressions. Use this it to visualize the total number of visits to a server for example, or to overlay a particular metric with a previous year to see a change in trends.You can also set up monitoring for these graphs.Monitor a web server's error rate by dividing the error count by the access count, use linear regression to calculate and monitor the number of days until a disk's free space is exhausted. Expressions can be used to implement metric monitoring in a variety of different ways.
External Monitoring
Monitoring in closest proximity to the user
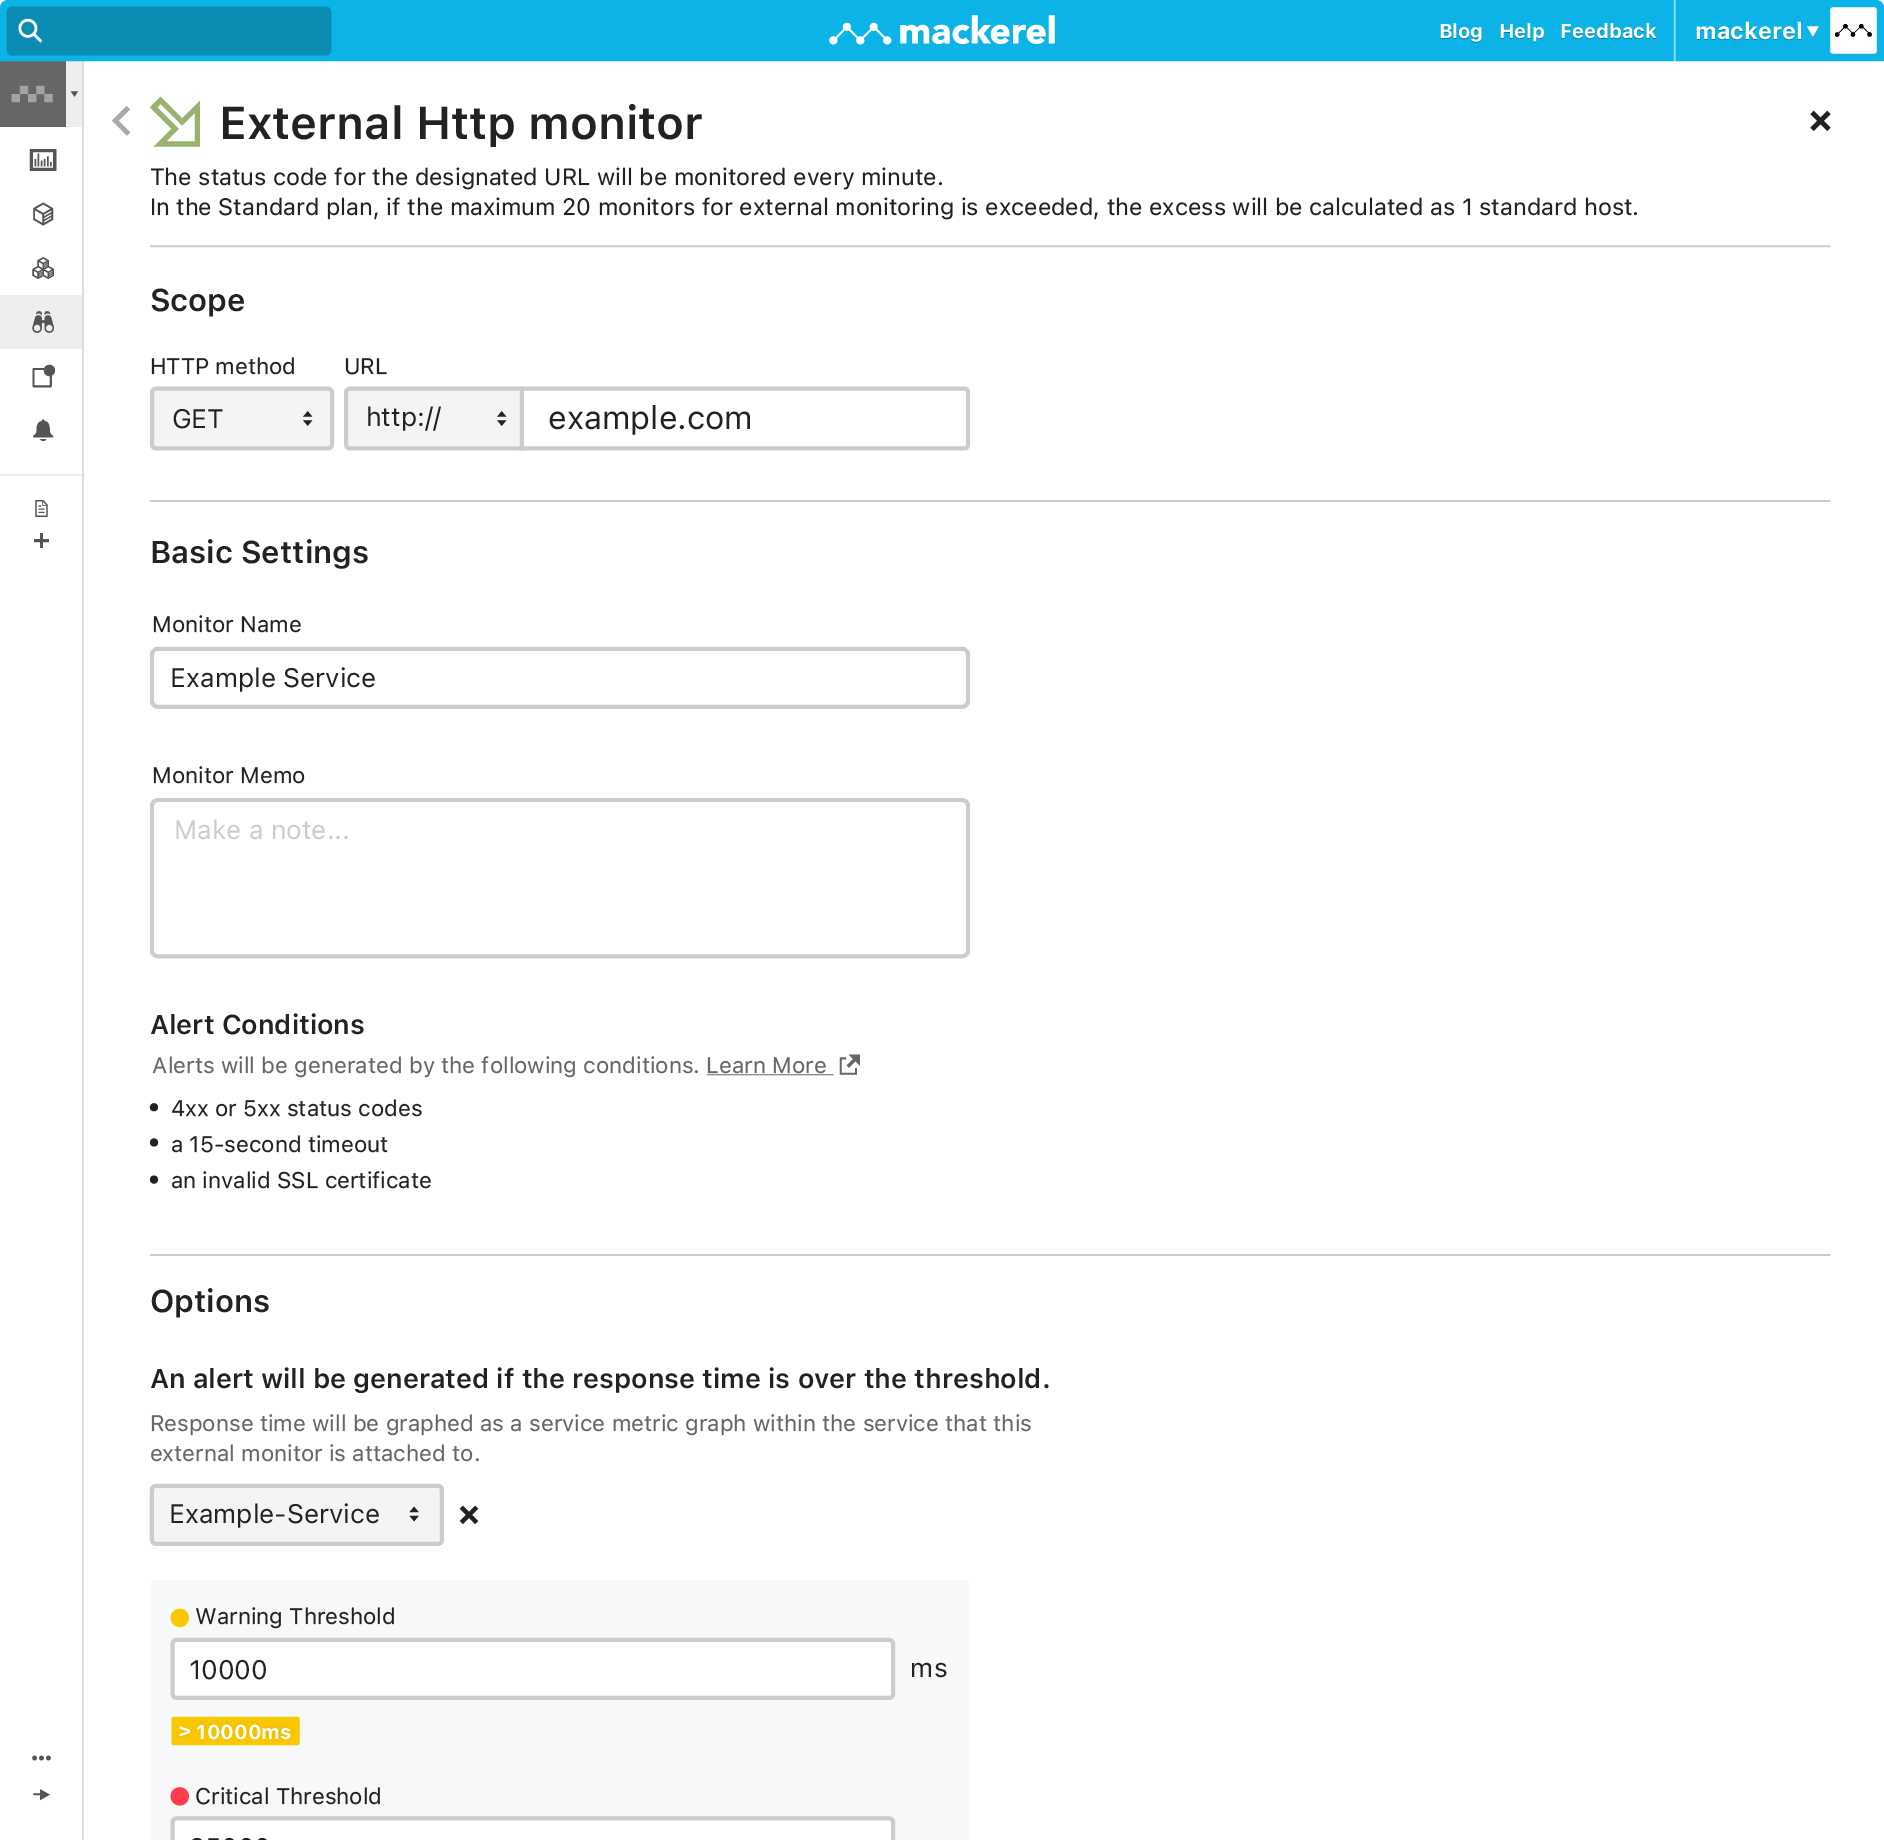
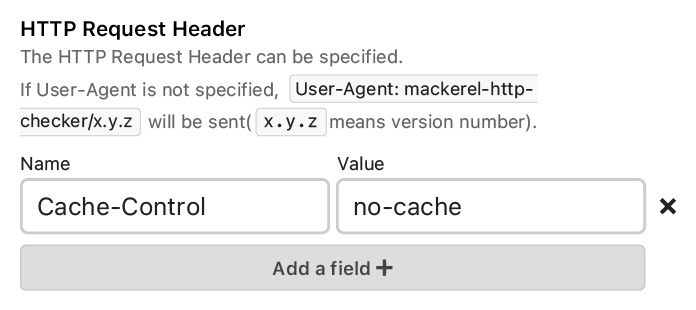
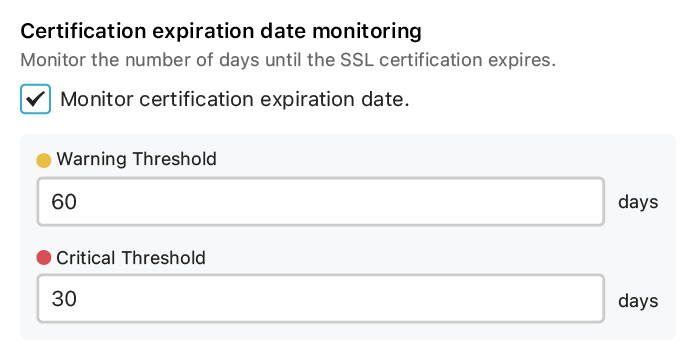
The external monitoring feature lets you send requests to a specified URL and monitor items such as status code, response body content, and response time. You can also monitor an SSL certificate's expiration date if the URL access protocol is HTTPS.External monitoring is responsible for monitoring items that are in closest proximity to your target user. In other words, it most directly tracks how users interact with your site / application.
Anomaly Detection
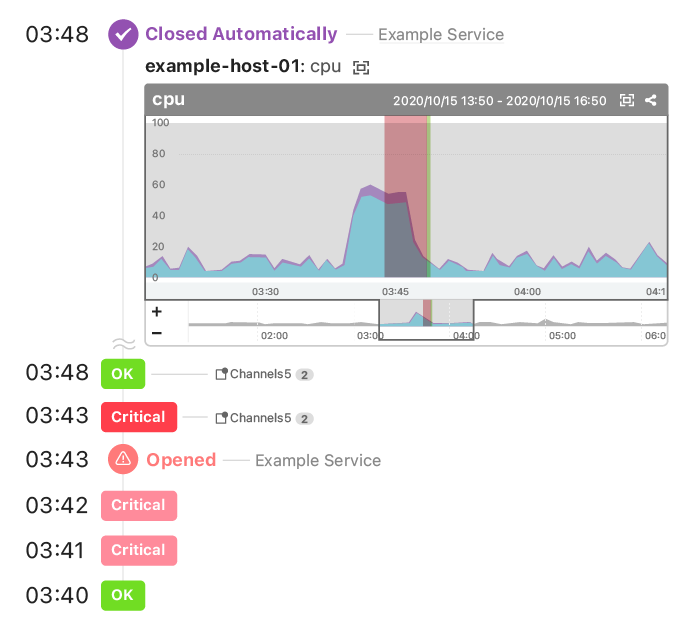
Reinforce monitoring configurations that require substantial knowledge and experience with machine learning.
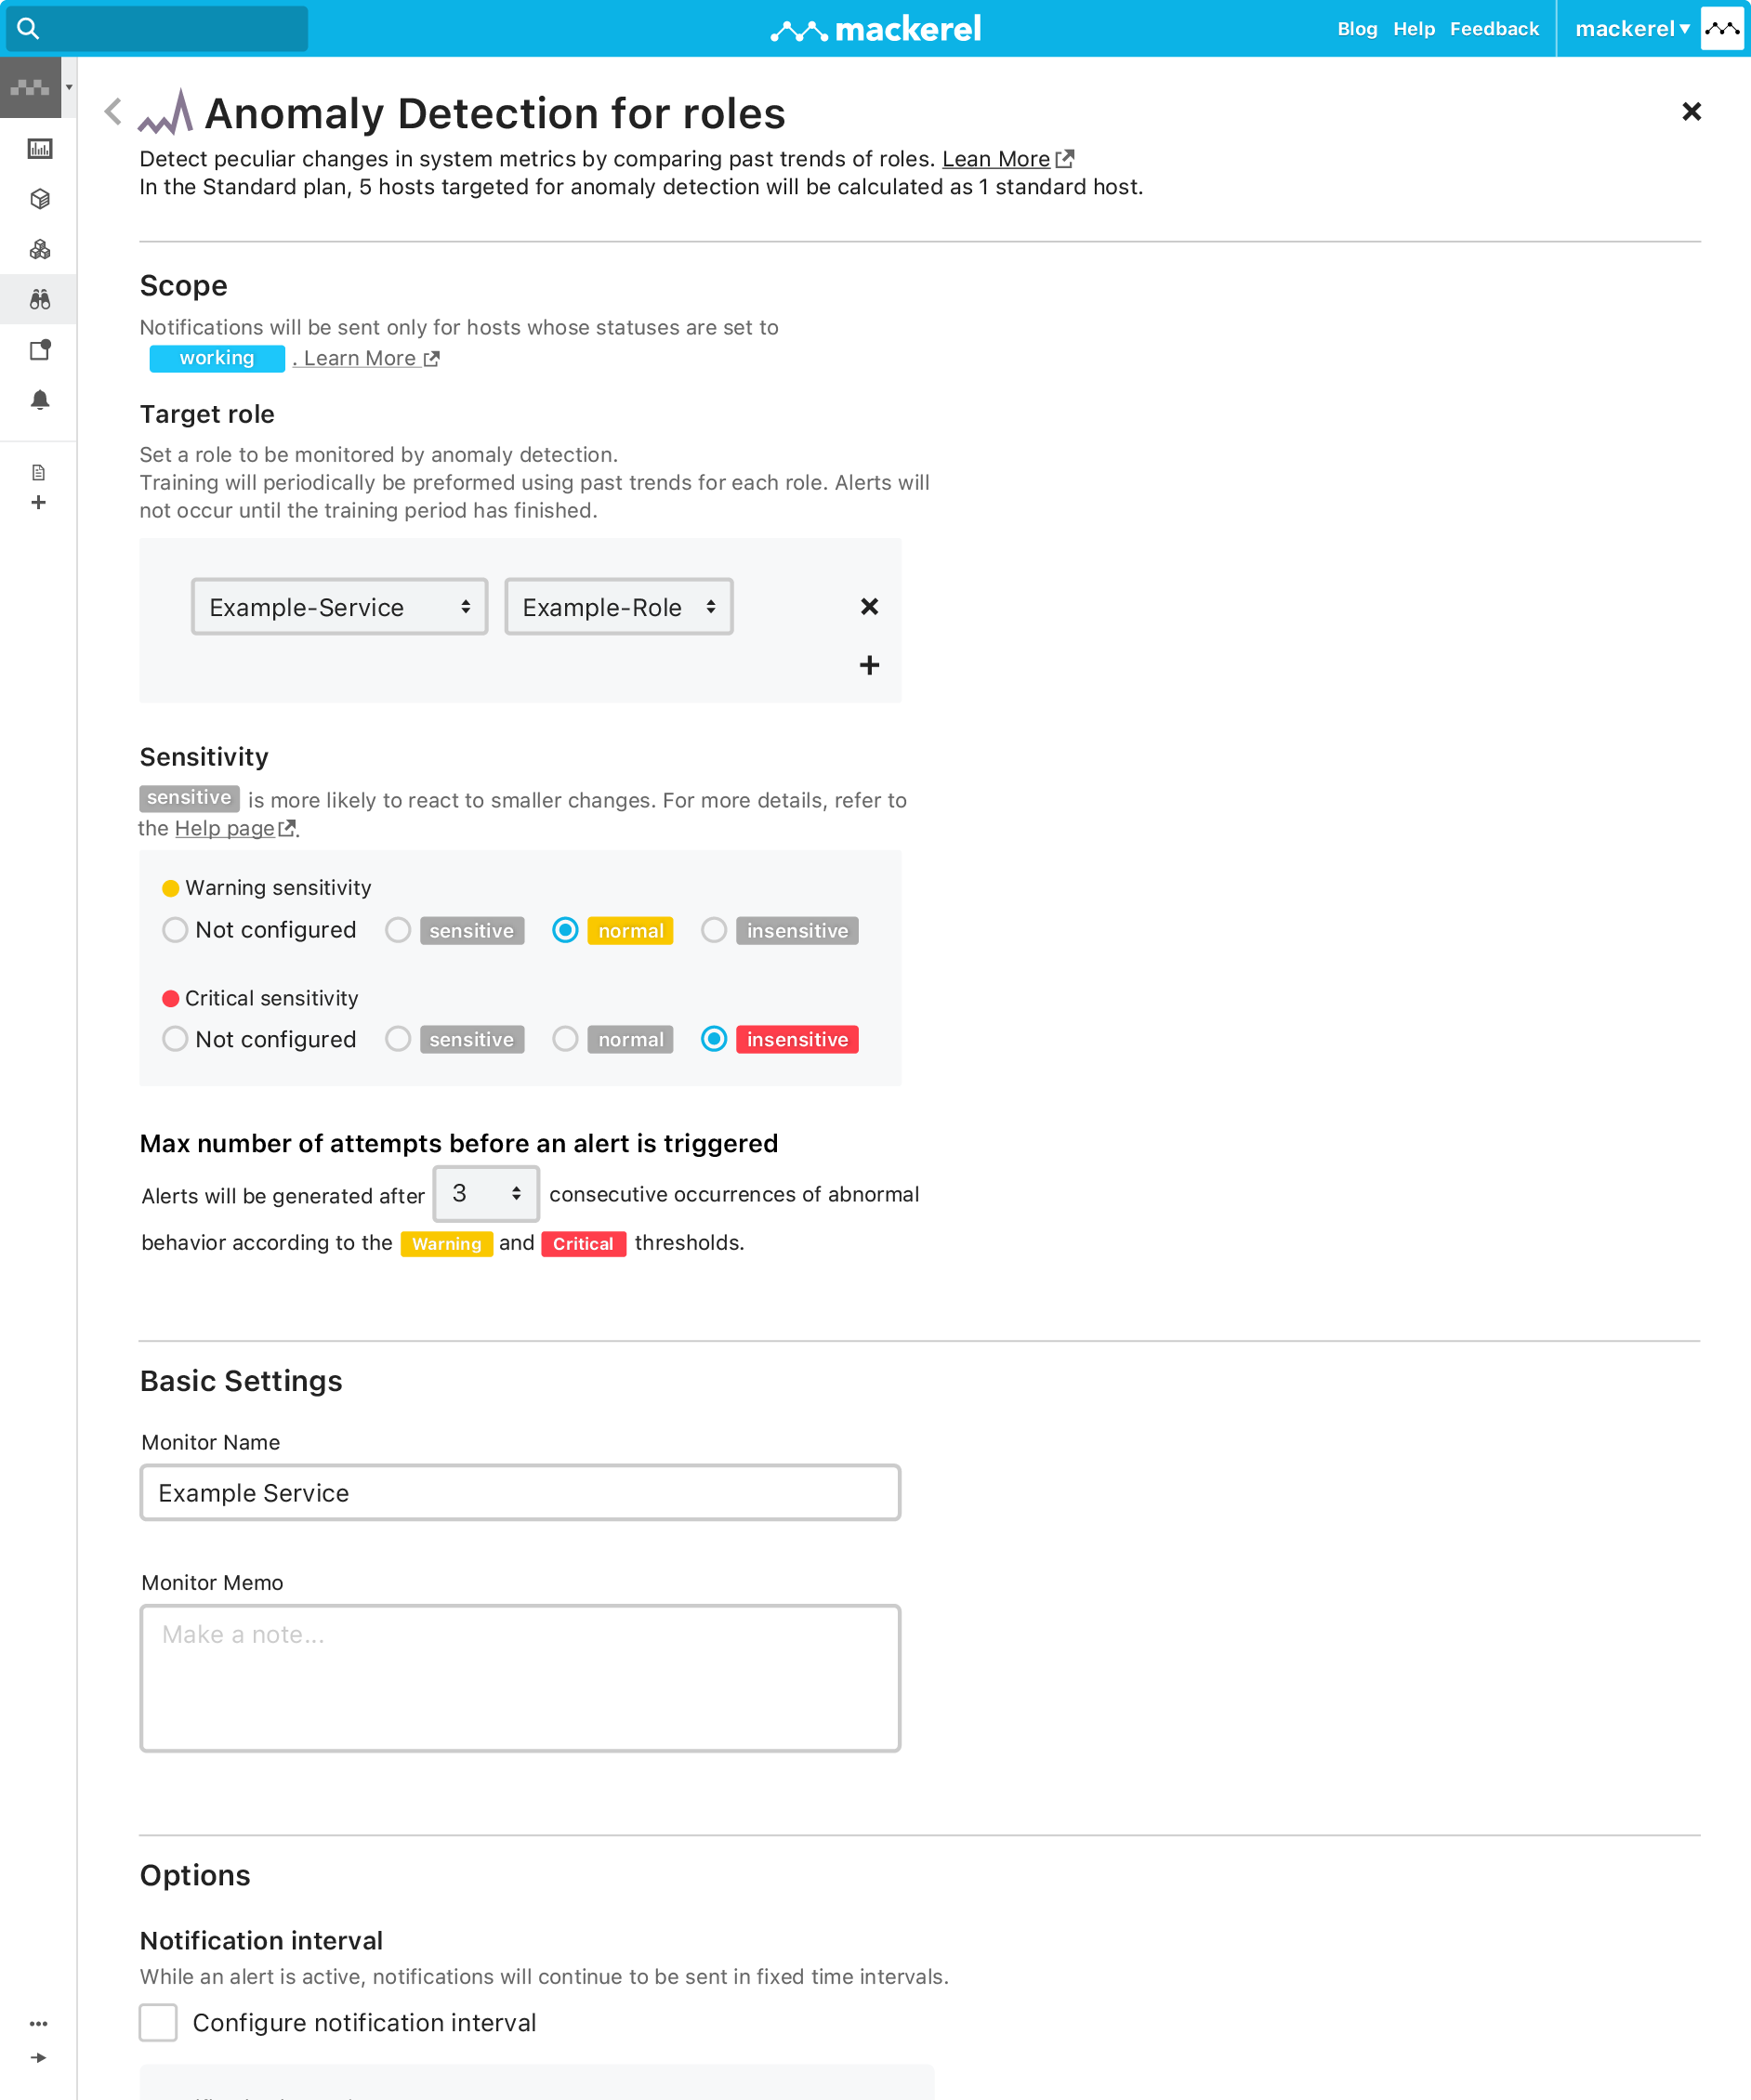
In order to specify metric thresholds accurately, a certain amount of knowledge and experience is needed. Monitoring configurations require trial and error, even for systems with abundant operational data. Mackerel's Anomaly Detection for Roles function uses machine learning to study past trends of server metrics in a given role and alert you when deviated values are detected. System periodicity is also supported. If trends vary depending on the time of day or day of the week, learning takes that into account.Using Anomaly Detection for Roles to supplement your own operational knowledge will help you discover failures that past knowledge cannot be applied and improve monitoring.
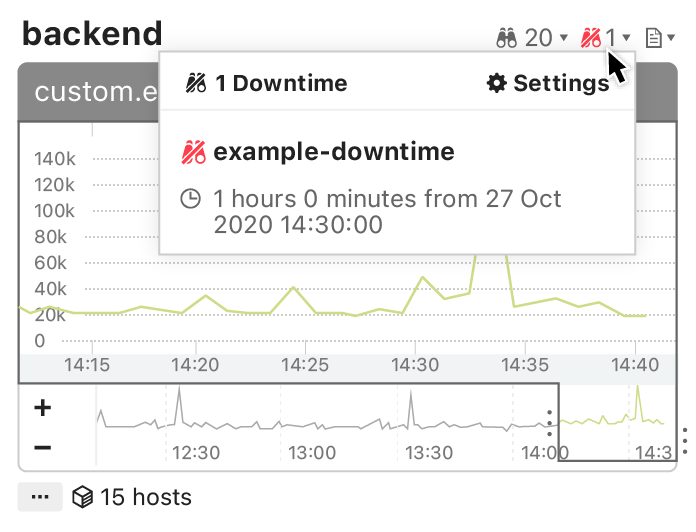
Downtime
Systematically suspend alerts during scheduled batches and maintenance
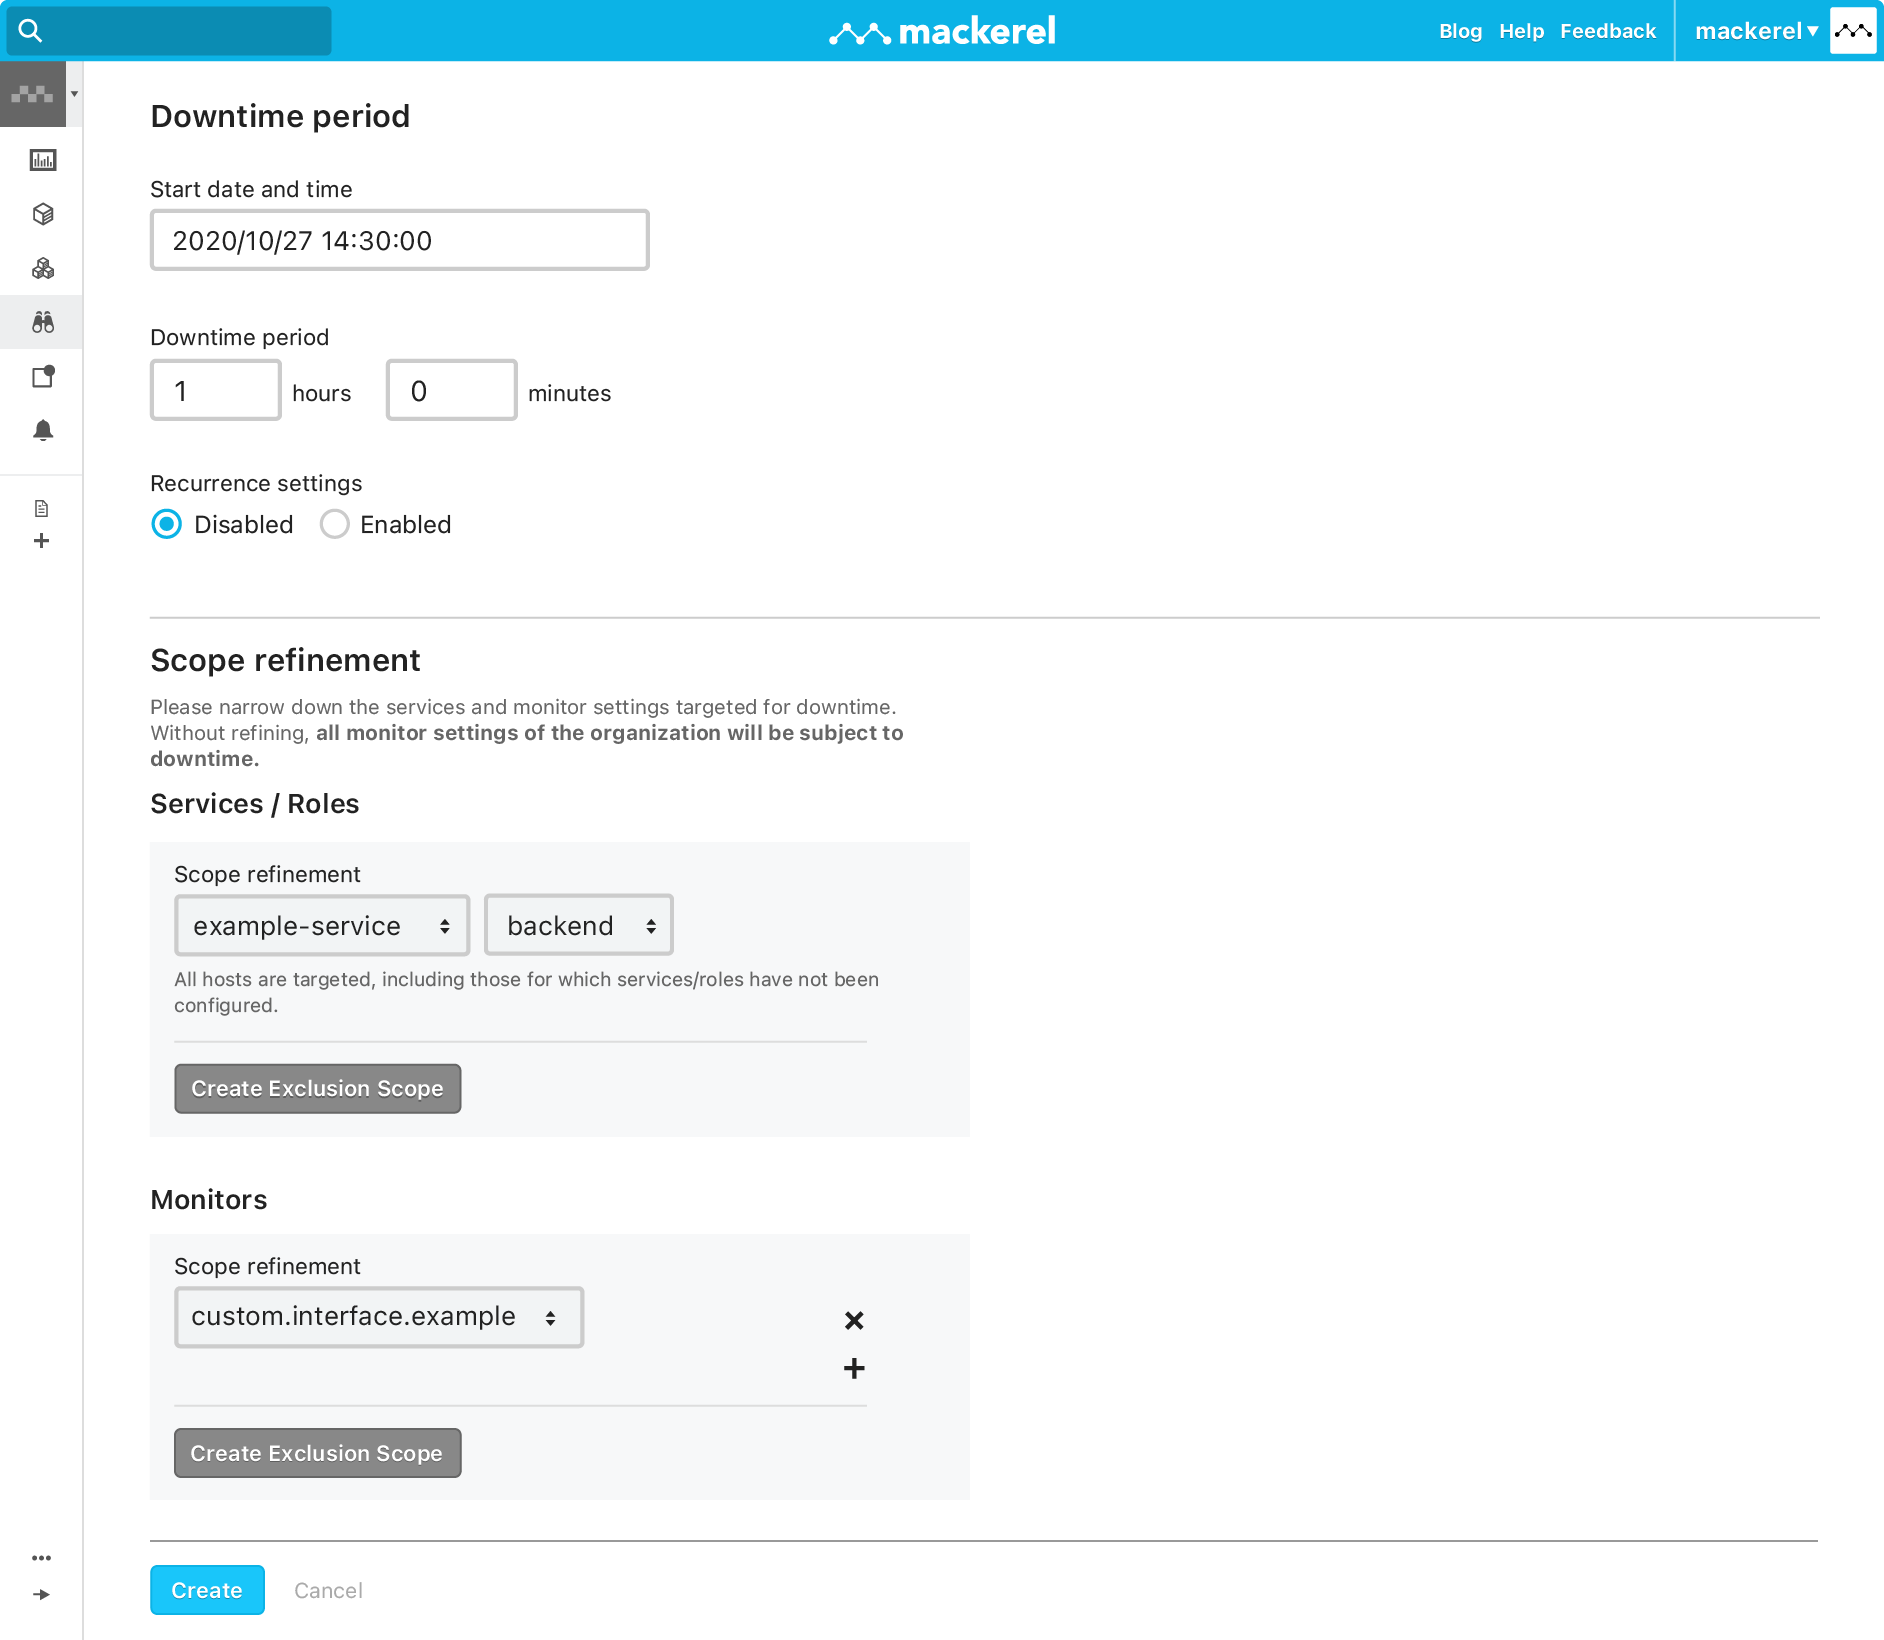
In Mackerel, there are several functions that you can use to stop monitoring or notifications, but Downtime lets you set the timing to support scheduled batches and maintenance. You can also suspend monitoring by specifying the time zone, target service, role, and monitor. You can also set it from the API.
Features
Why choose Mackerel?
-

Overwhelmingly Simple Installation
Simply install the monitoring agent on your server and you're ready to start monitoring.
See details -

Full-fledged Monitoring
The ability to integrate various communication tools promotes information sharing within teams and creates an opportunity to foster monitoring based on the state of the system.
See details -

Advanced Monitoring
Take advantage of advanced functions such as combining multiple metrics, monitoring predicted values, and using machine learning to detect anomalies that deviate from past trends.
See details -

Multi-cloud and Containers
Centrally manage various infrastructure environments such as containers and the cloud.
See details -

Customize and Automate
Use plugins to support environment compatability. Plugins are made available as OSS and can be expanded to match unique environments.
See details