Full-fledged Monitoring
Monitor your resources and immediately pick up on anomalies.Flexible settings accomadate the tool of your choice,be it Slack, Chatwork, Microsoft Teams, PagerDuty, or Twilio.Sharing information is made easy which in turn promotesteam communication and improves monitoring.
Monitoring Rules
Monitor a wide range of metrics with flexibility
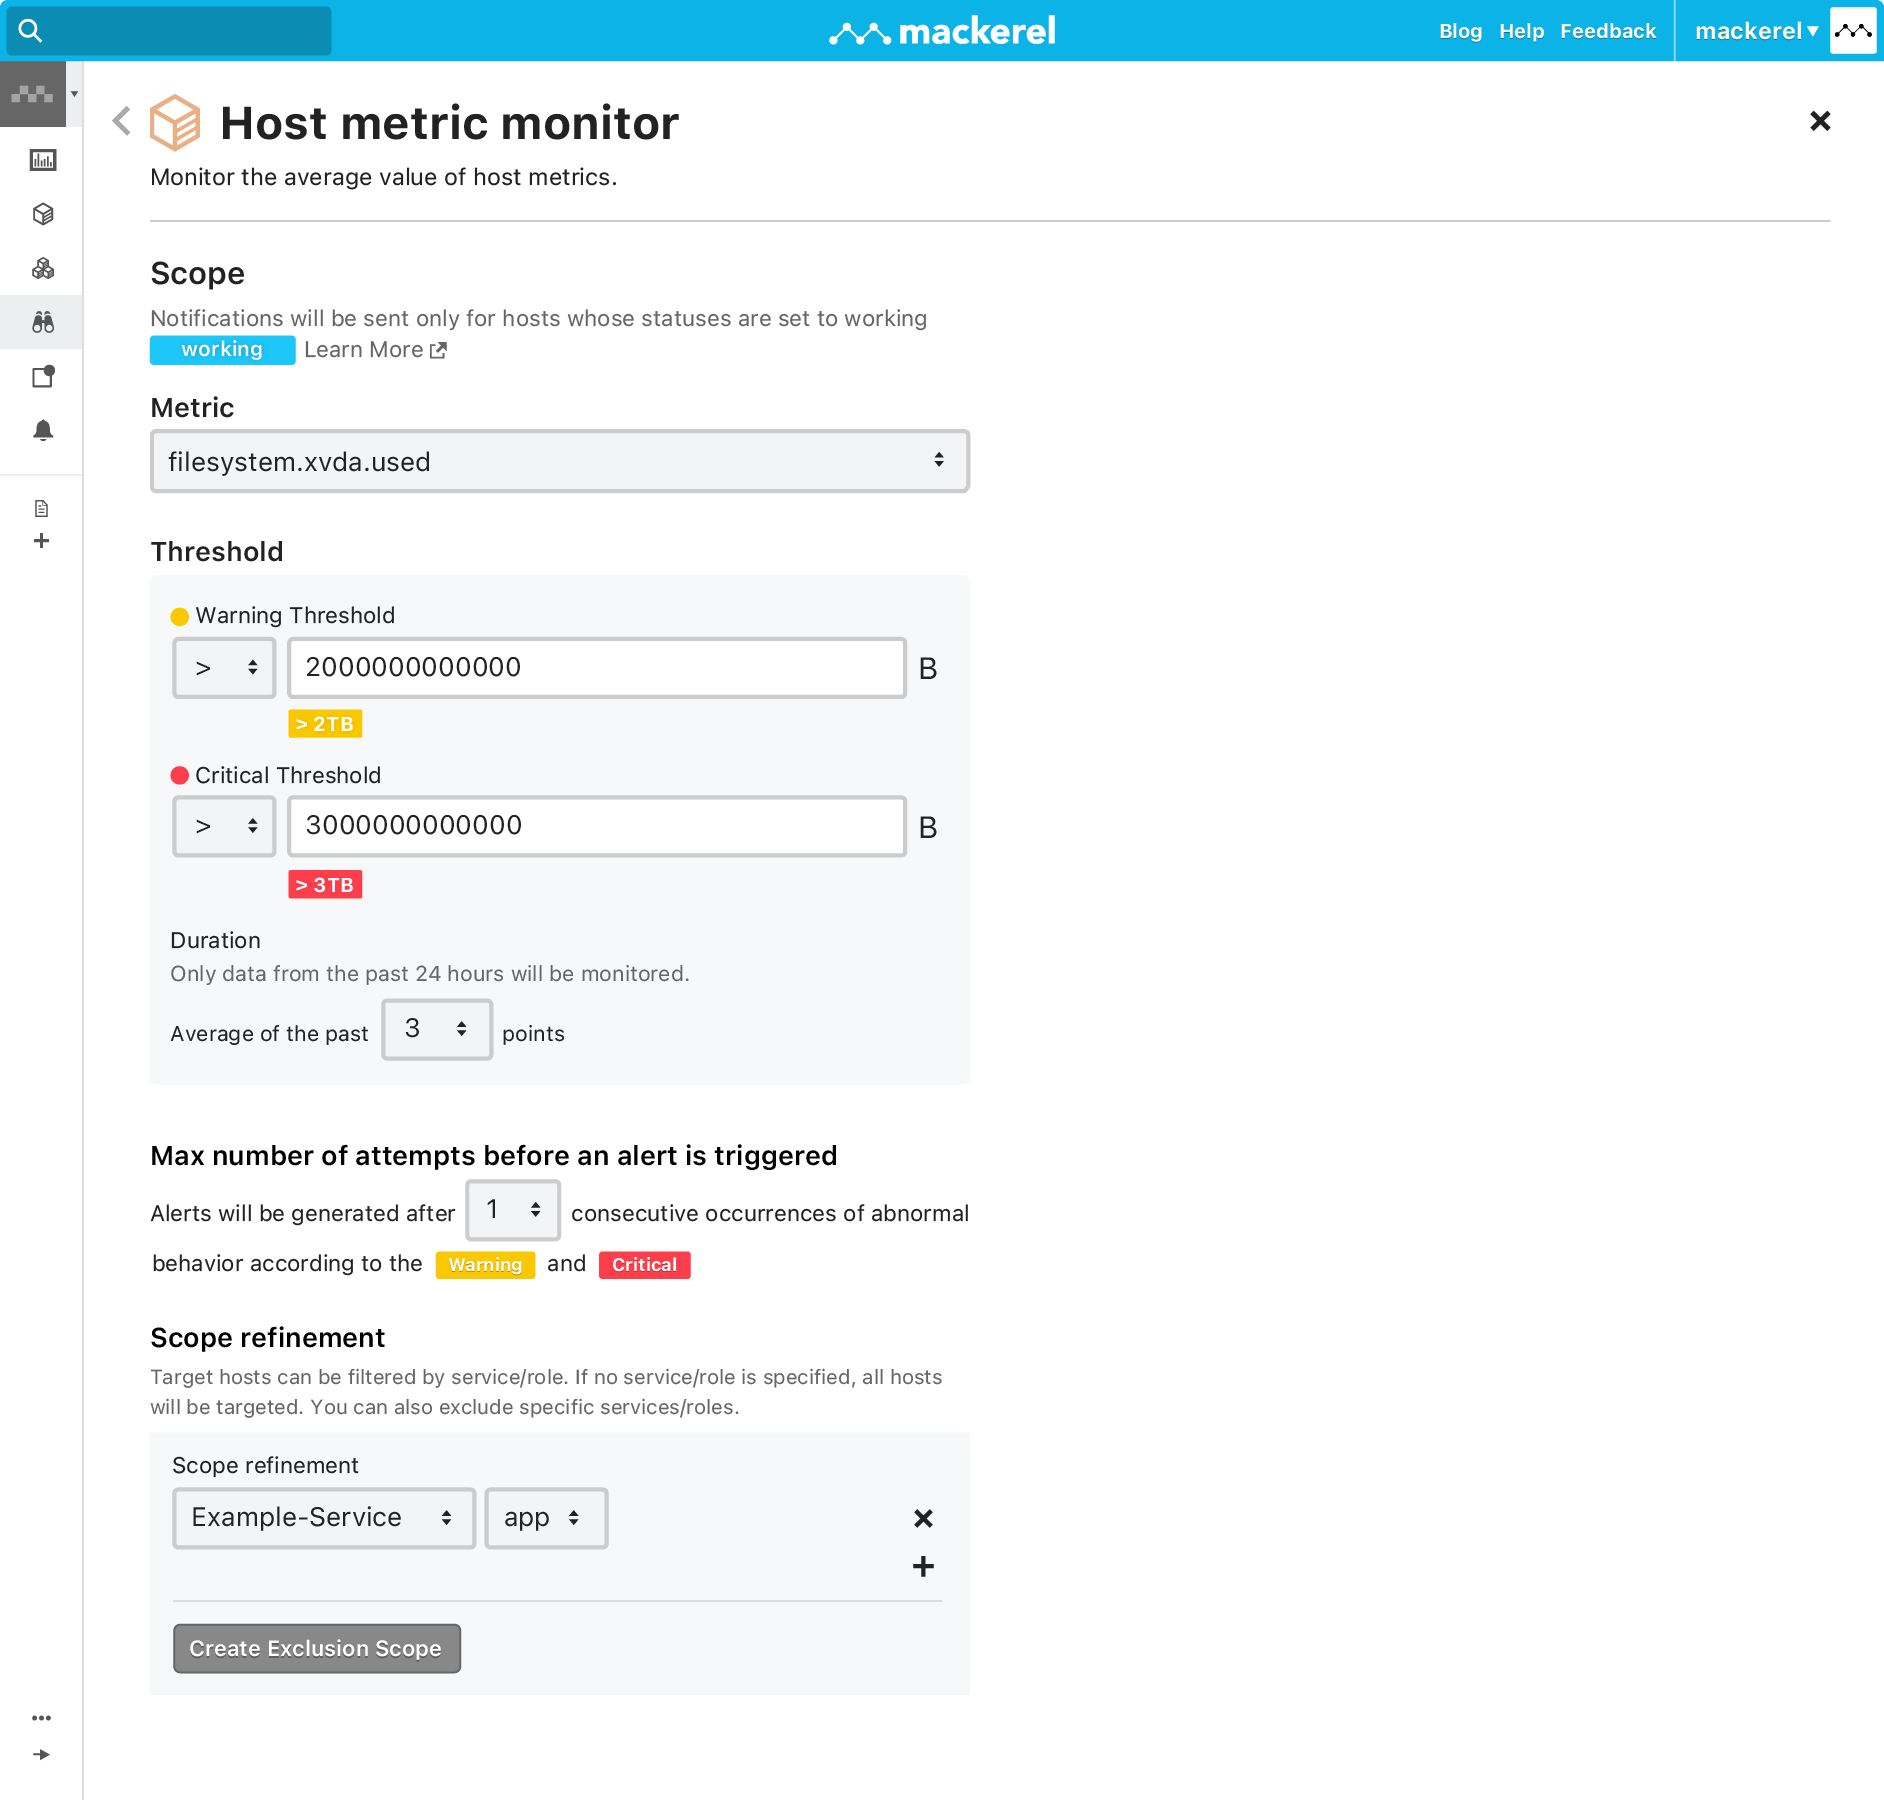
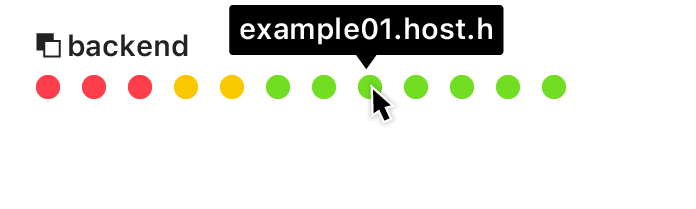
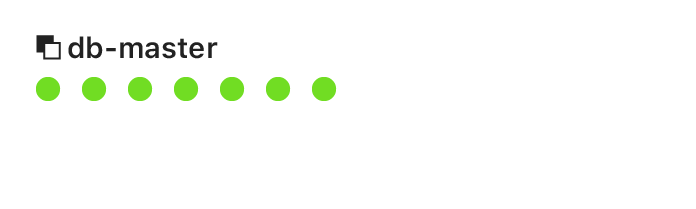
Create monitoring rules based on server resource data sent from the agent installed on your monitoring target. Along with standard metrics such as CPU, memory usage, and load average, you can also monitor customized metrics such as JVM, AWS RDS, and ELB statuses. And Instead of applying monitoring rules to individual servers, targets can be specified using Mackerel's unique concepts "services" and "roles" to match the characteristics of your infrastructure environment.
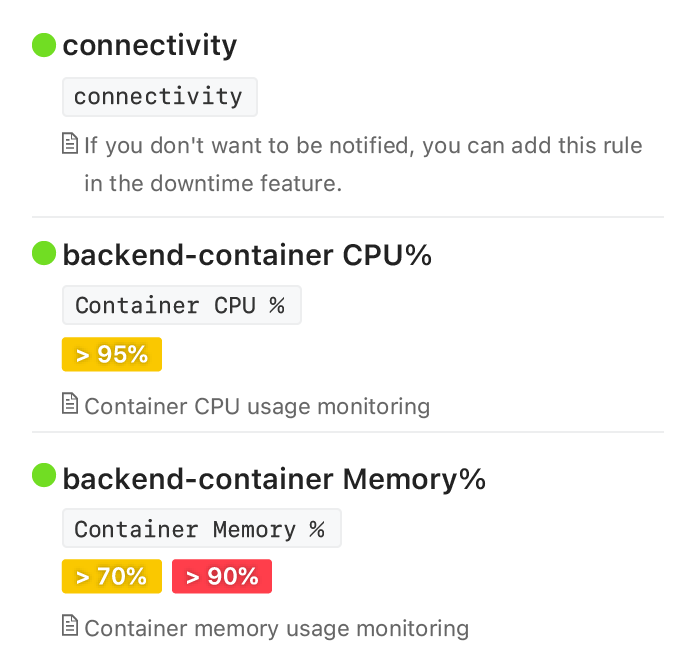
Alerts
Visualize changes in a way that's easy-to-understand
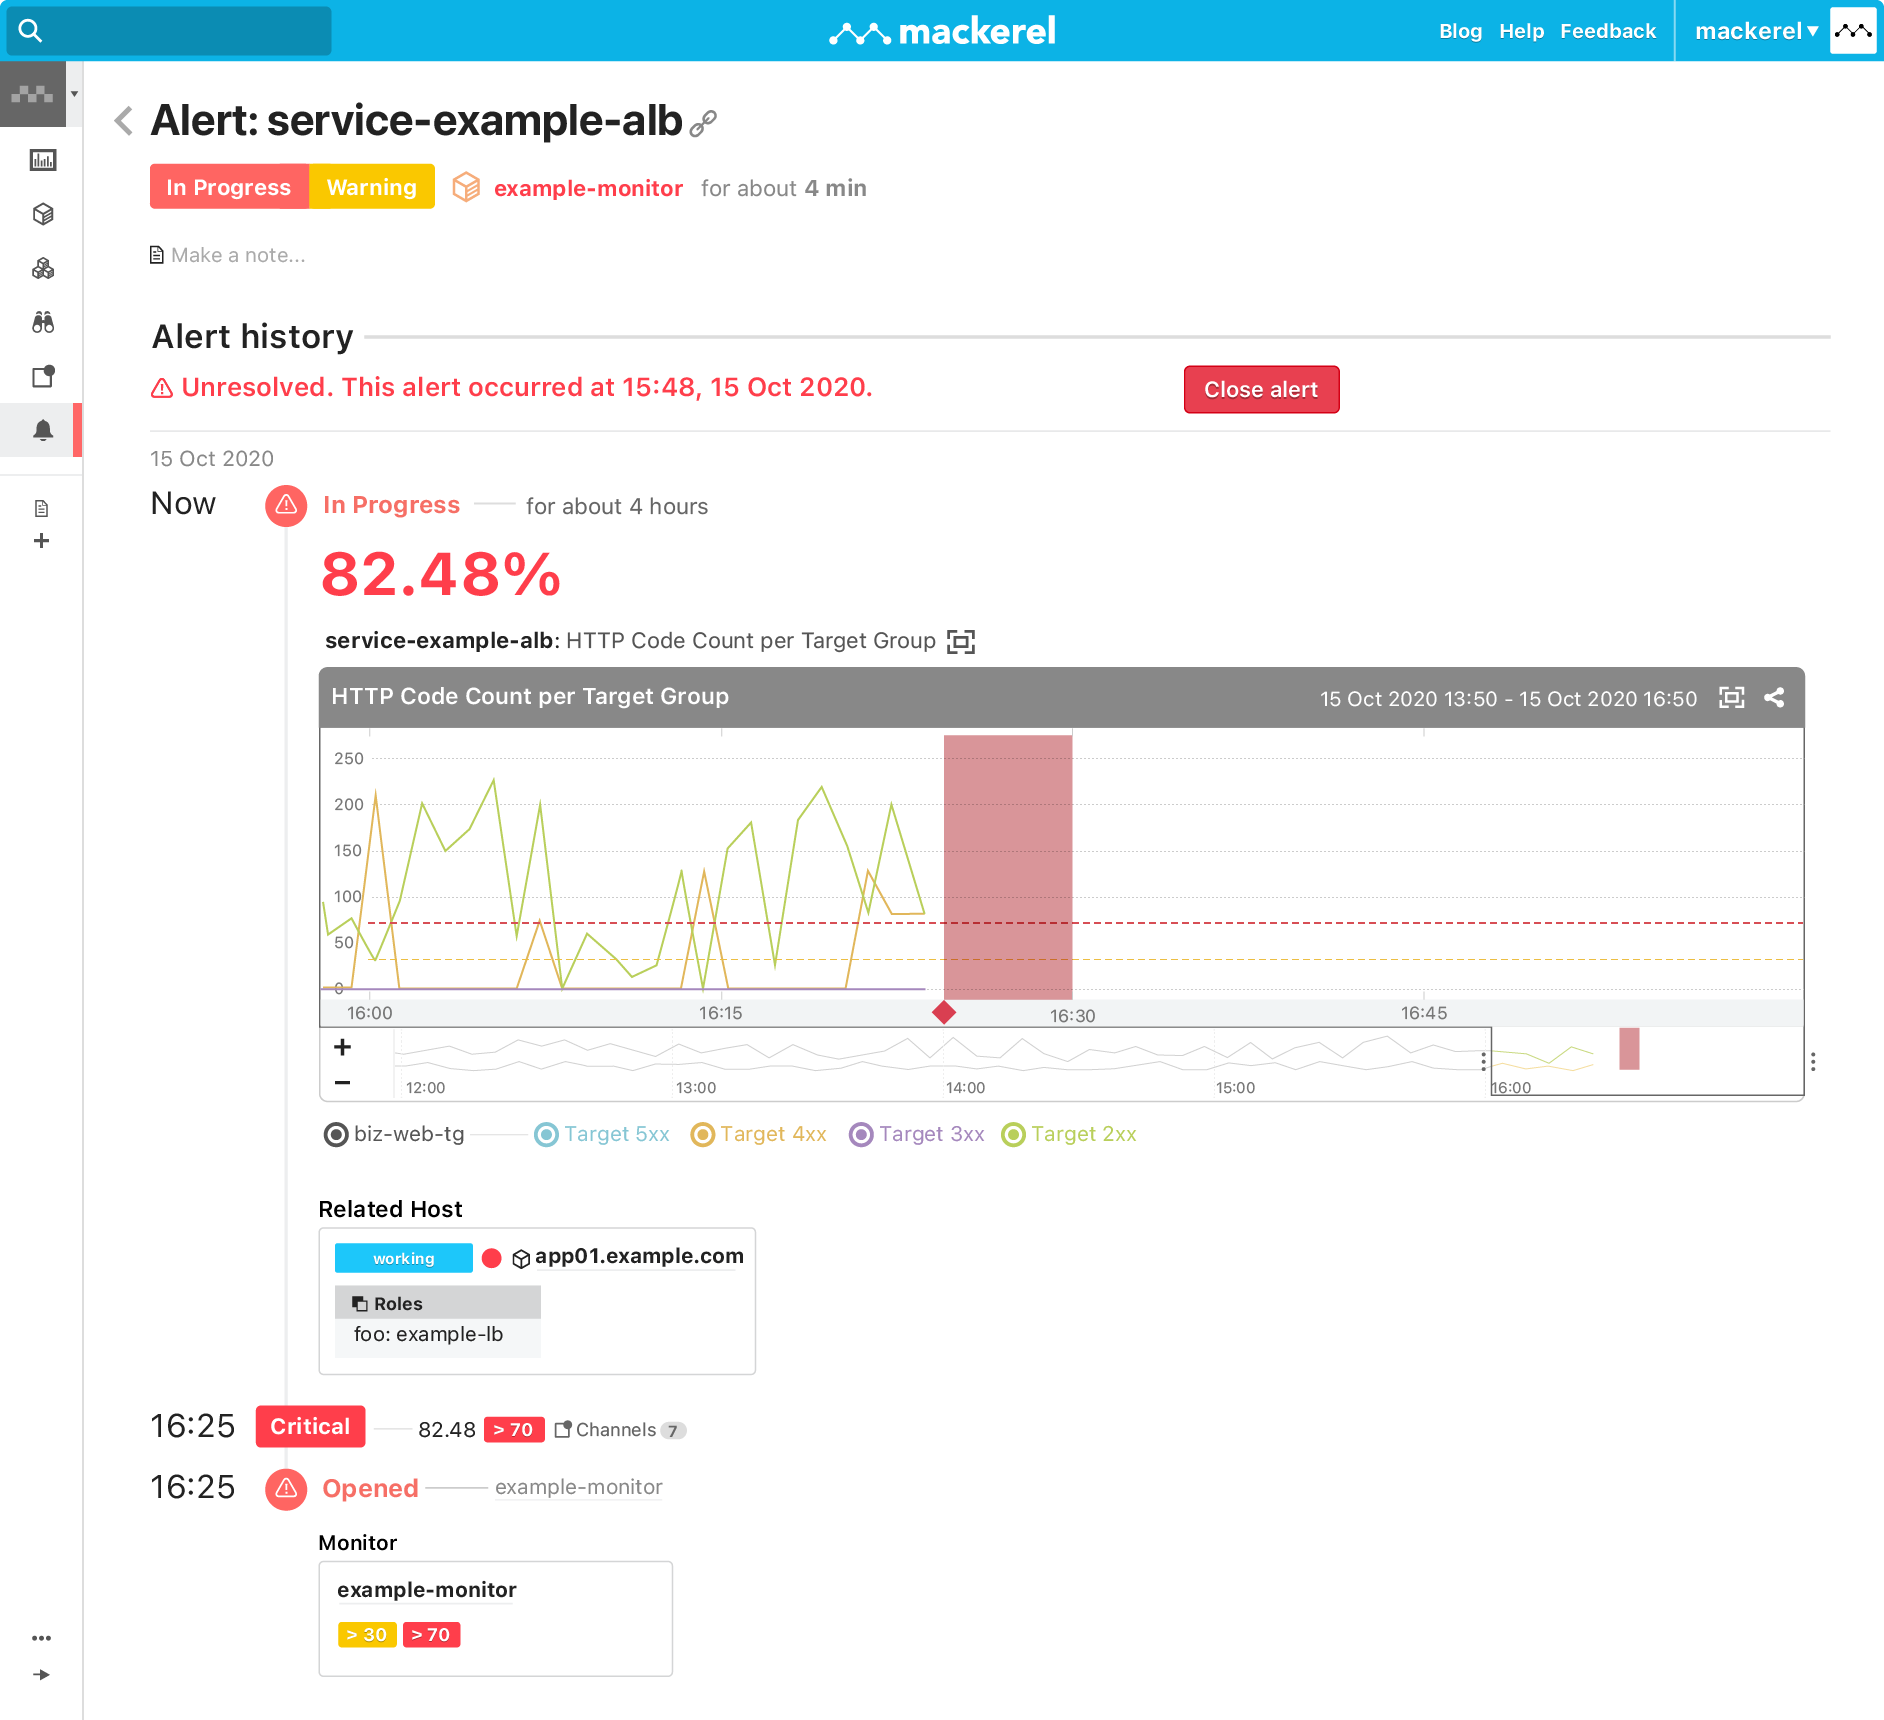
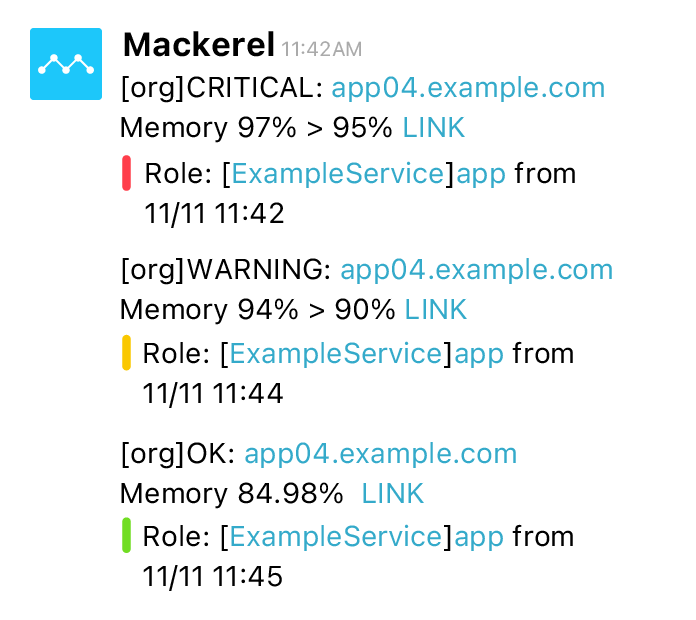
"Warning" and "Critical" monitor thresholds let you to quickly distinguish between urgent alerts that require immediate attention and those that can be responded to later. Receive notifications via a variety of channels and manage alerts on the web. For each alert, any change is visualized with a timestamp, which can help resolve the issue. You can also avoid an onslaught of alerts by grouping them together.
Notifications
Get notifications from a plethora of different services
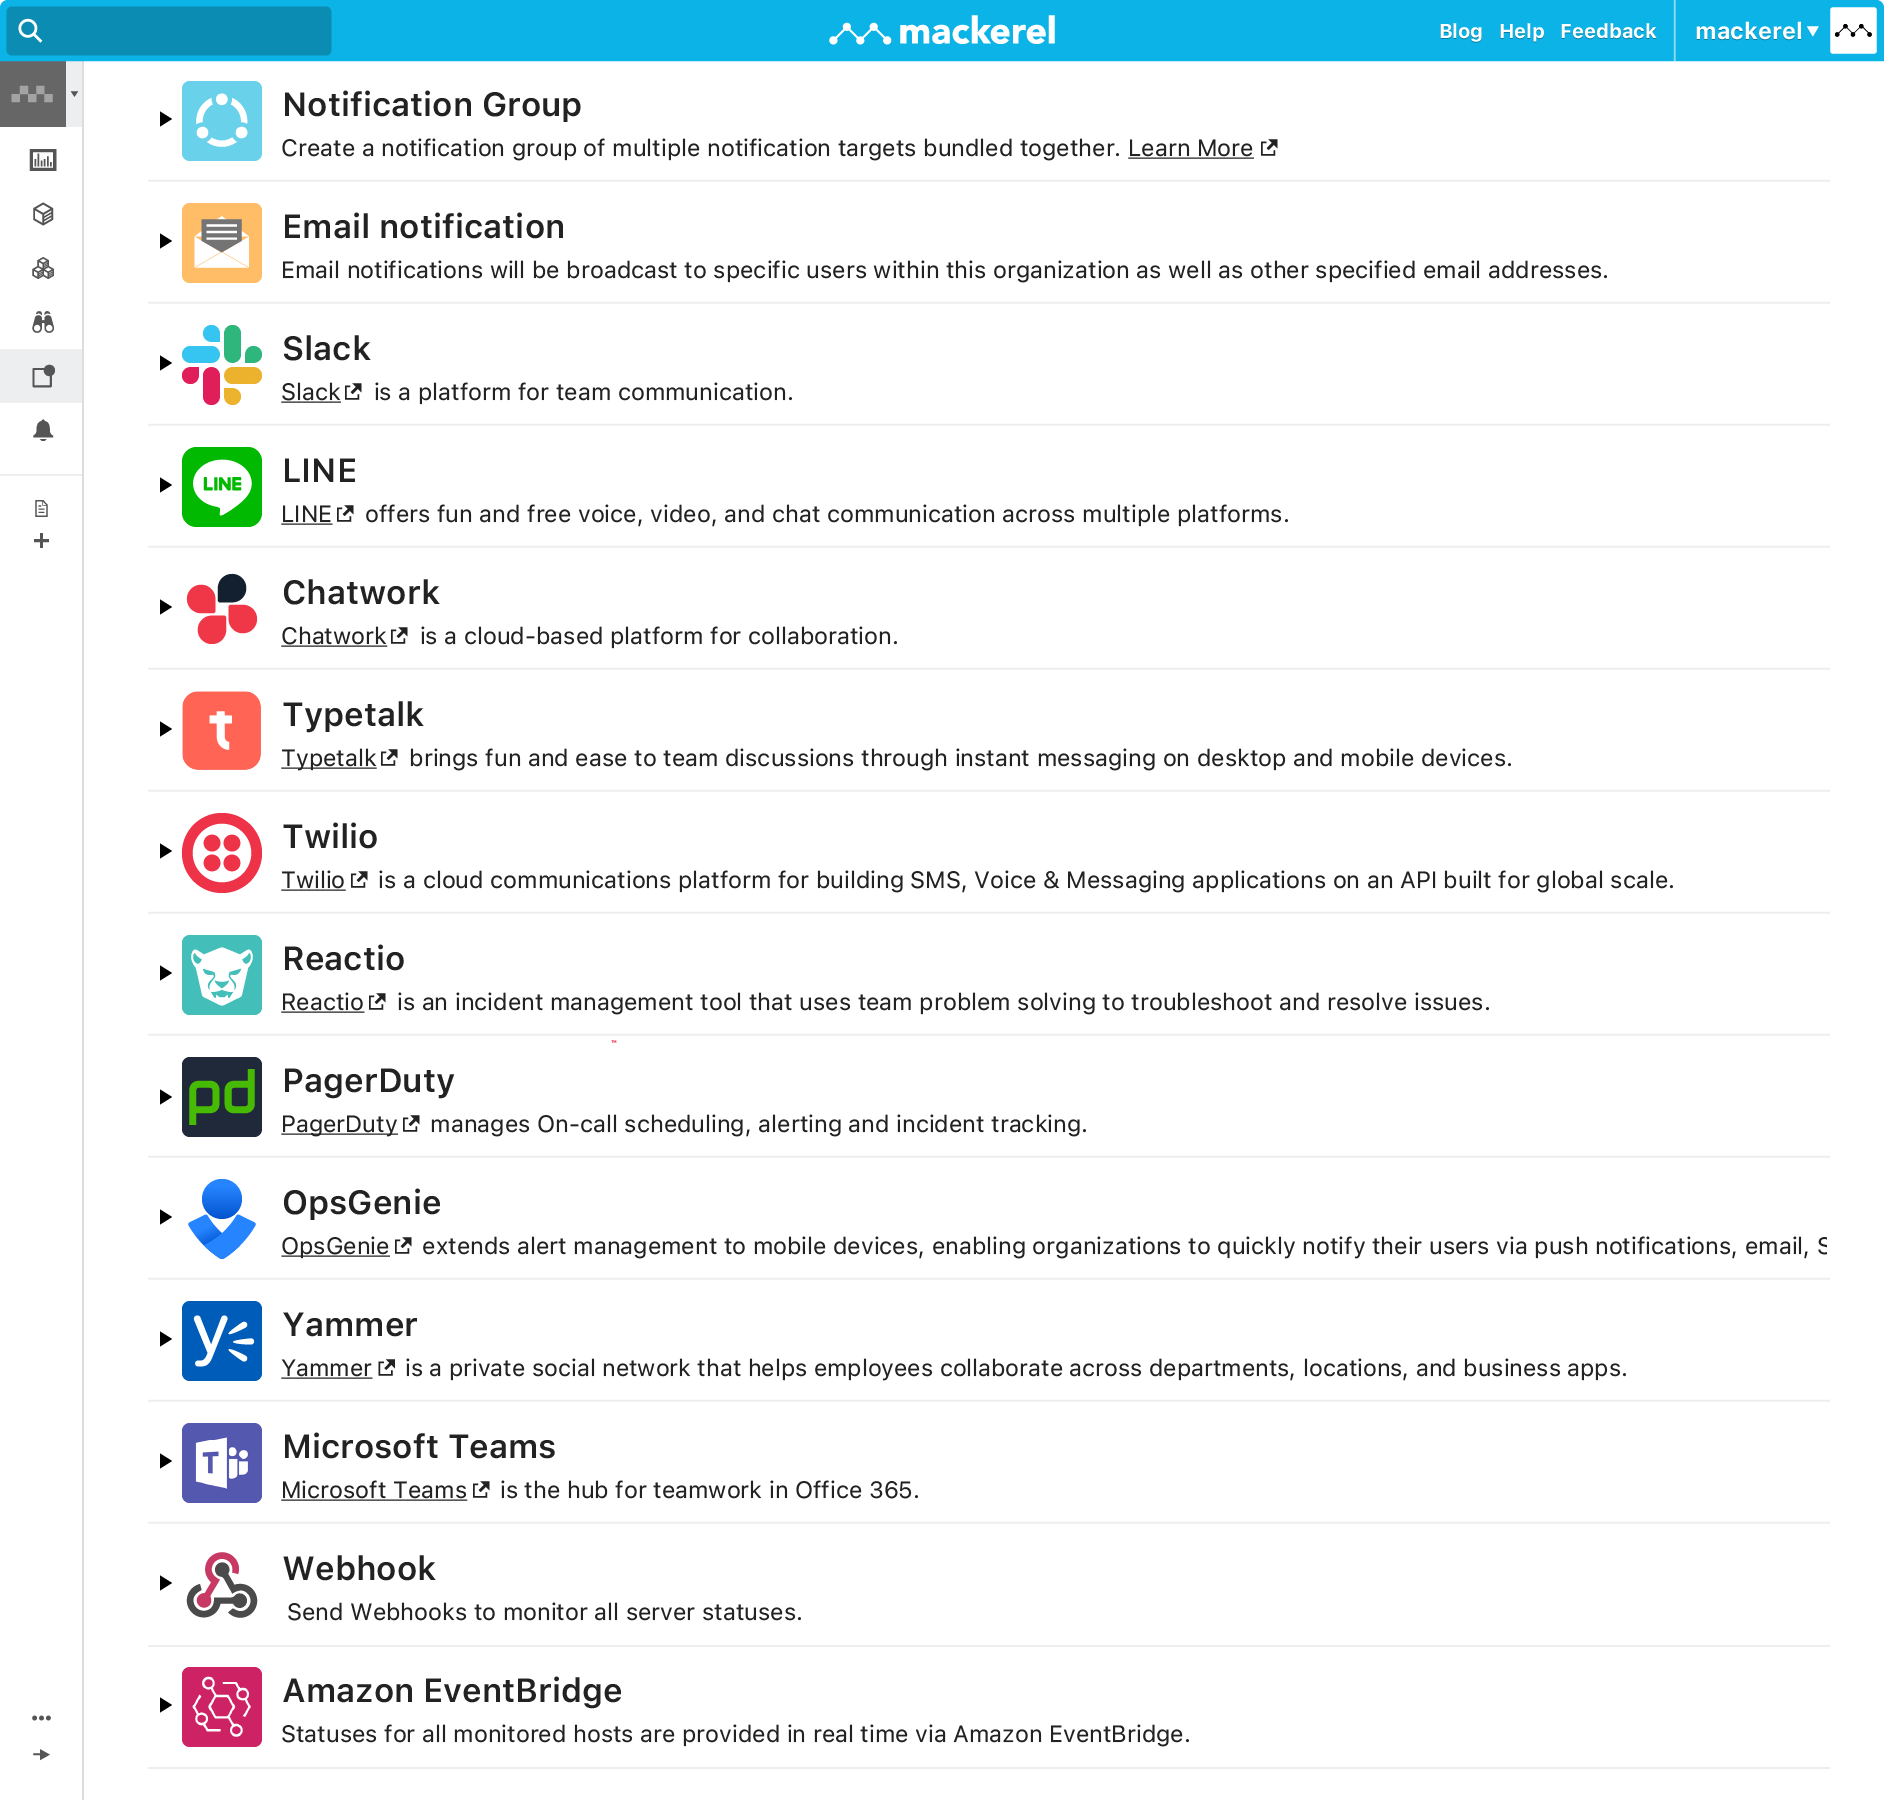
Besides email, alerts can be sent to a variety of different services such as Slack, LINE, Chatwork, Webhooks to arbitrary URLs, and so on. Different notification methods can be used according to the content of the alert. You can also use notification groups to sort alerts by team.
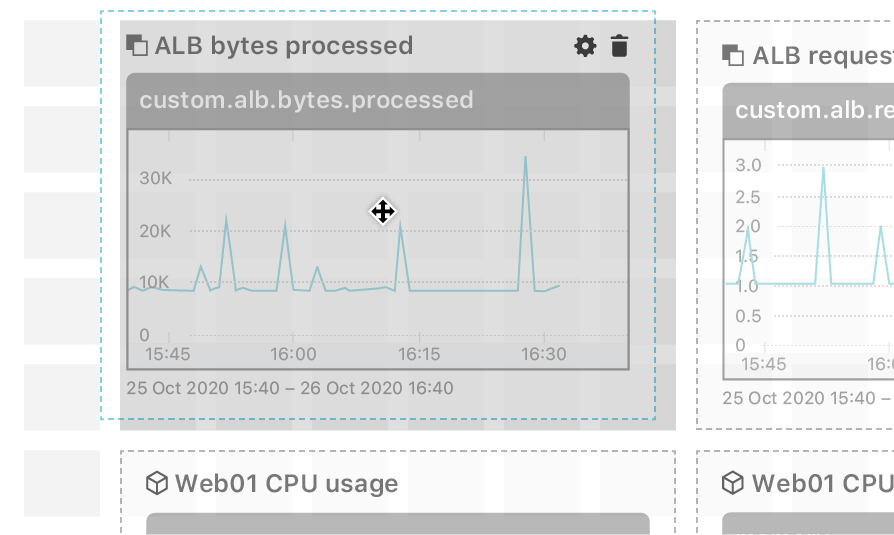
Custom Dashboards
A communication hub for your teamwith diverse visualization
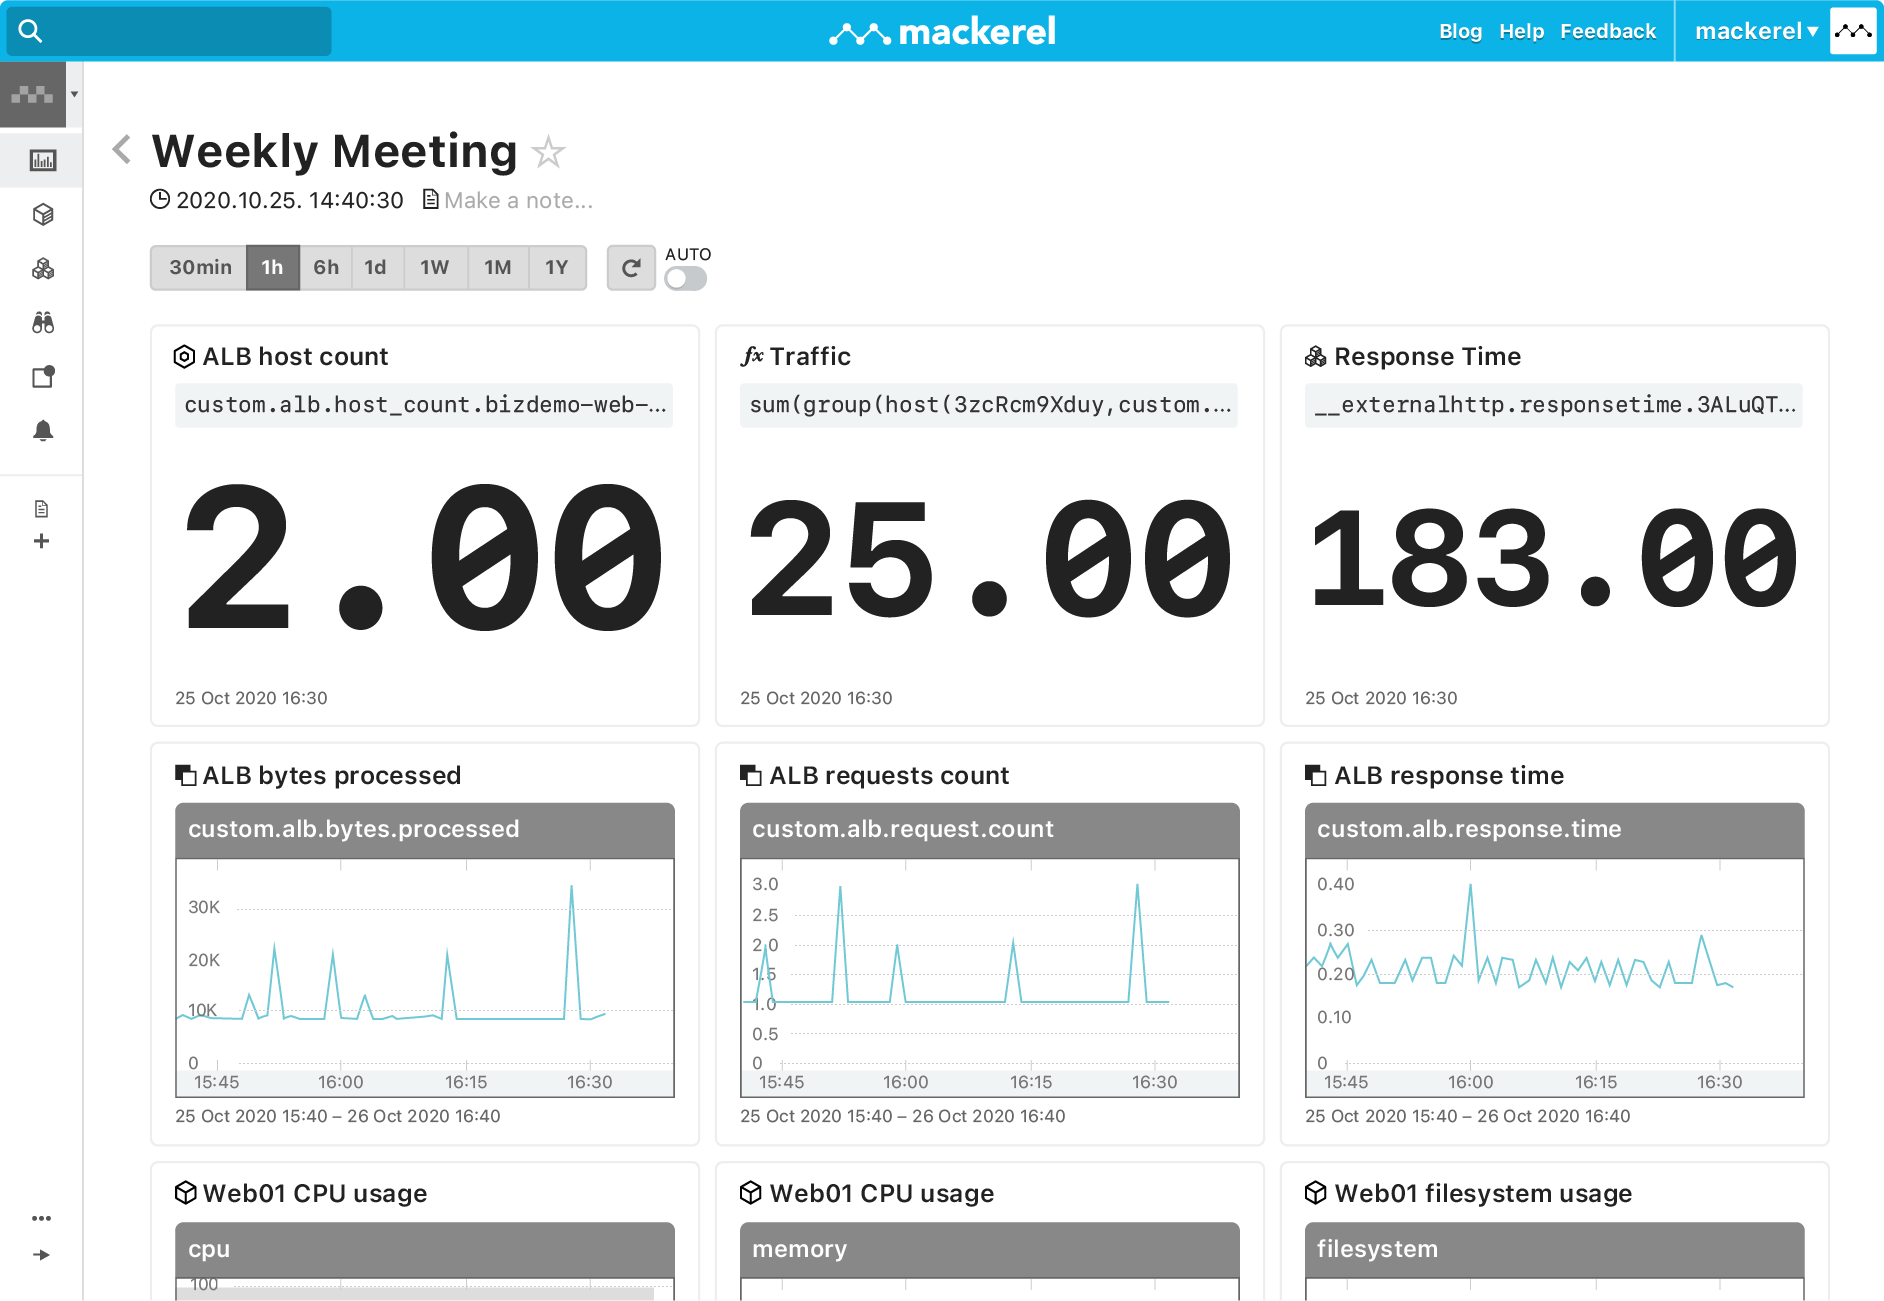
The Custom Dashboards feature lets you combine various widgets to create your own specialized dashboard. Widgets include graph widgets, number widgets, Markdown widgets, everything you need to create a dashboard.By combining service metrics and unique functions, you can monitor more than just servers, and you can link information beyond the framework of your team.Create dashboards that best fit your needs and help you run your product.
Features
Why choose Mackerel?
-
Overwhelmingly Simple Installation
Simply install the monitoring agent on your server and you're ready to start monitoring.
See details -

Full-fledged Monitoring
The ability to integrate various communication tools promotes information sharing within teams and creates an opportunity to foster monitoring based on the state of the system.
See details -

Advanced Monitoring
Take advantage of advanced functions such as combining multiple metrics, monitoring predicted values, and using machine learning to detect anomalies that deviate from past trends.
See details -
Multi-cloud and Containers
Centrally manage various infrastructure environments such as containers and the cloud.
See details -

Customize and Automate
Use plugins to support environment compatability. Plugins are made available as OSS and can be expanded to match unique environments.
See details