Overwhelmingly Simple Installation
Simply install Mackerel's monitoring agent on your server andyou're ready to start server monitoring.Our intuitive UI and easy-to-grasp concepts like'services' and 'roles' ensure a straight-forward process.
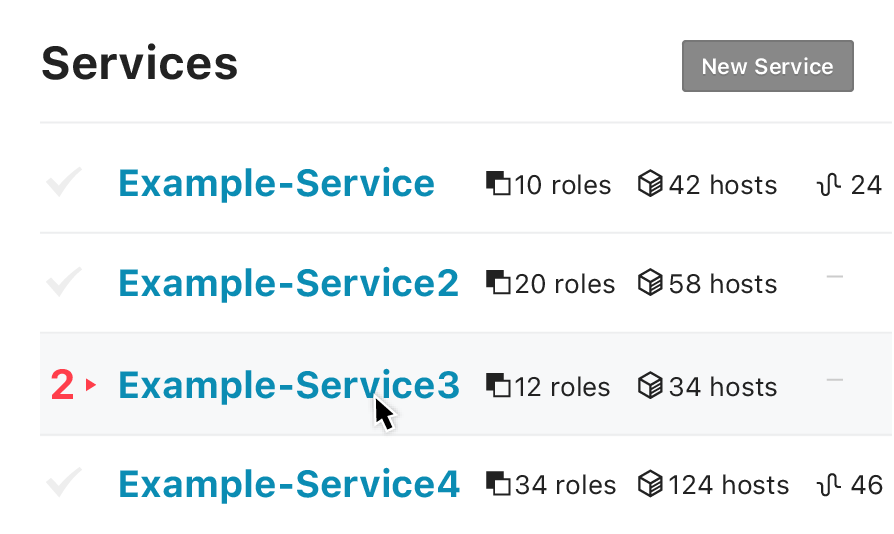
Services and Roles
Manage groups of servers by the 'role' they perform
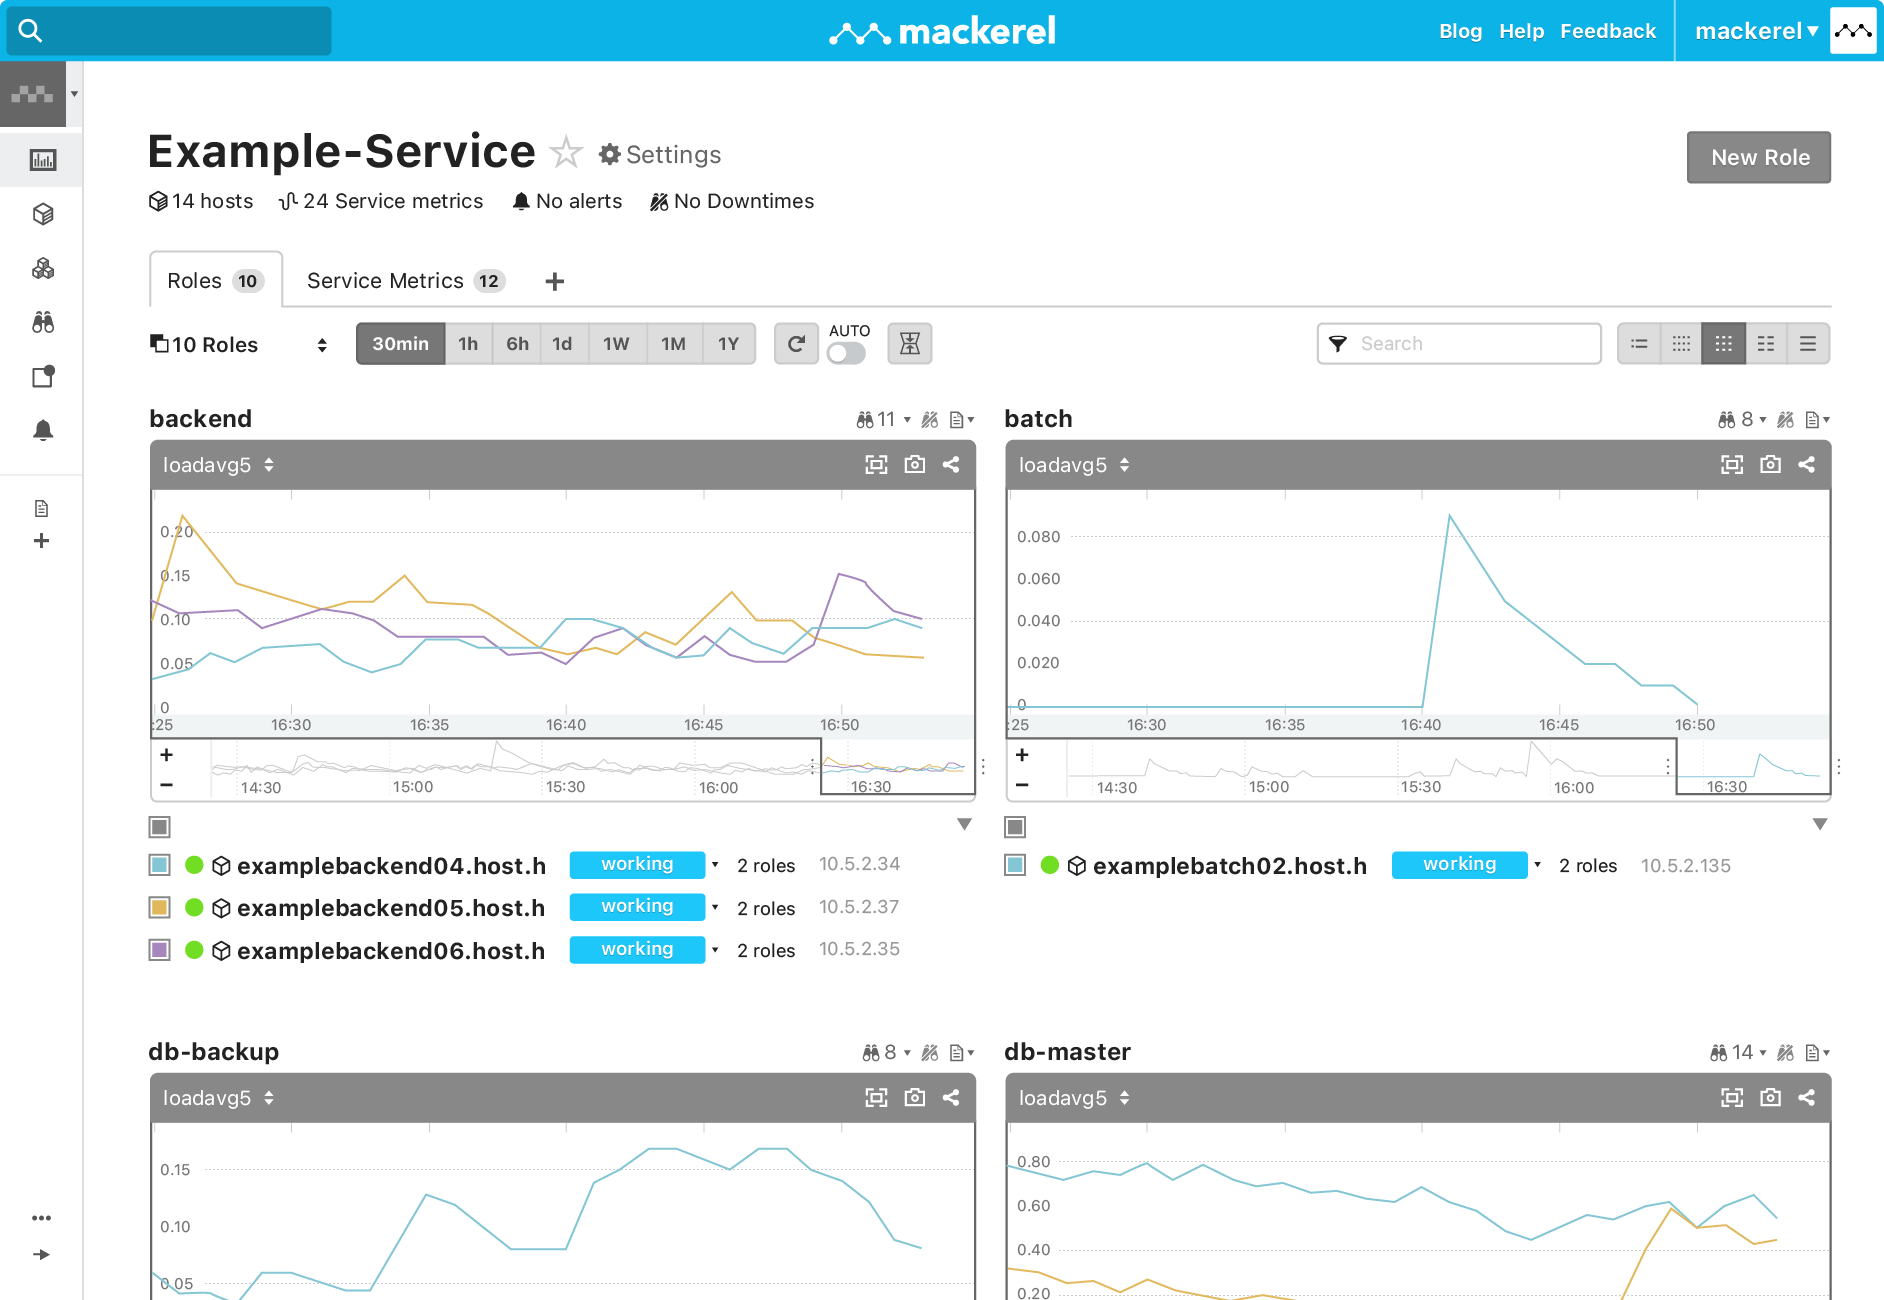
Through years of service operation, Hatena has cultivated an ideal way to classify multiple monitoring targets (hosts) by grouping them into 'services' and 'roles'. Services are grouped by the service that's provided, roles are grouped by the role that's performed such as 'application server' or 'database server'.
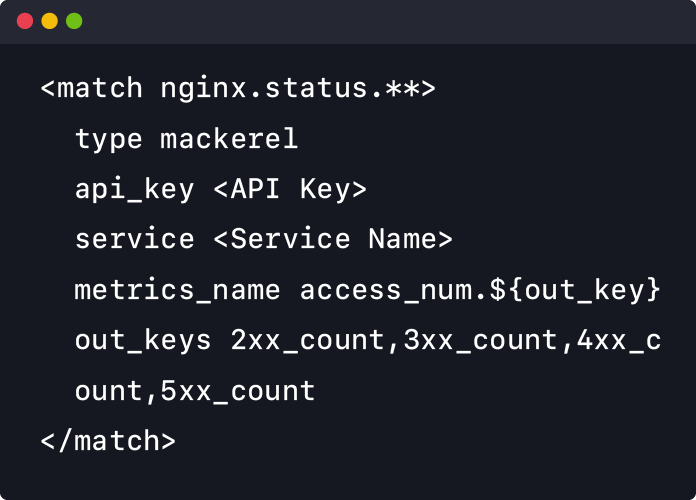
Service Metrics
Visualize the data that you care about most
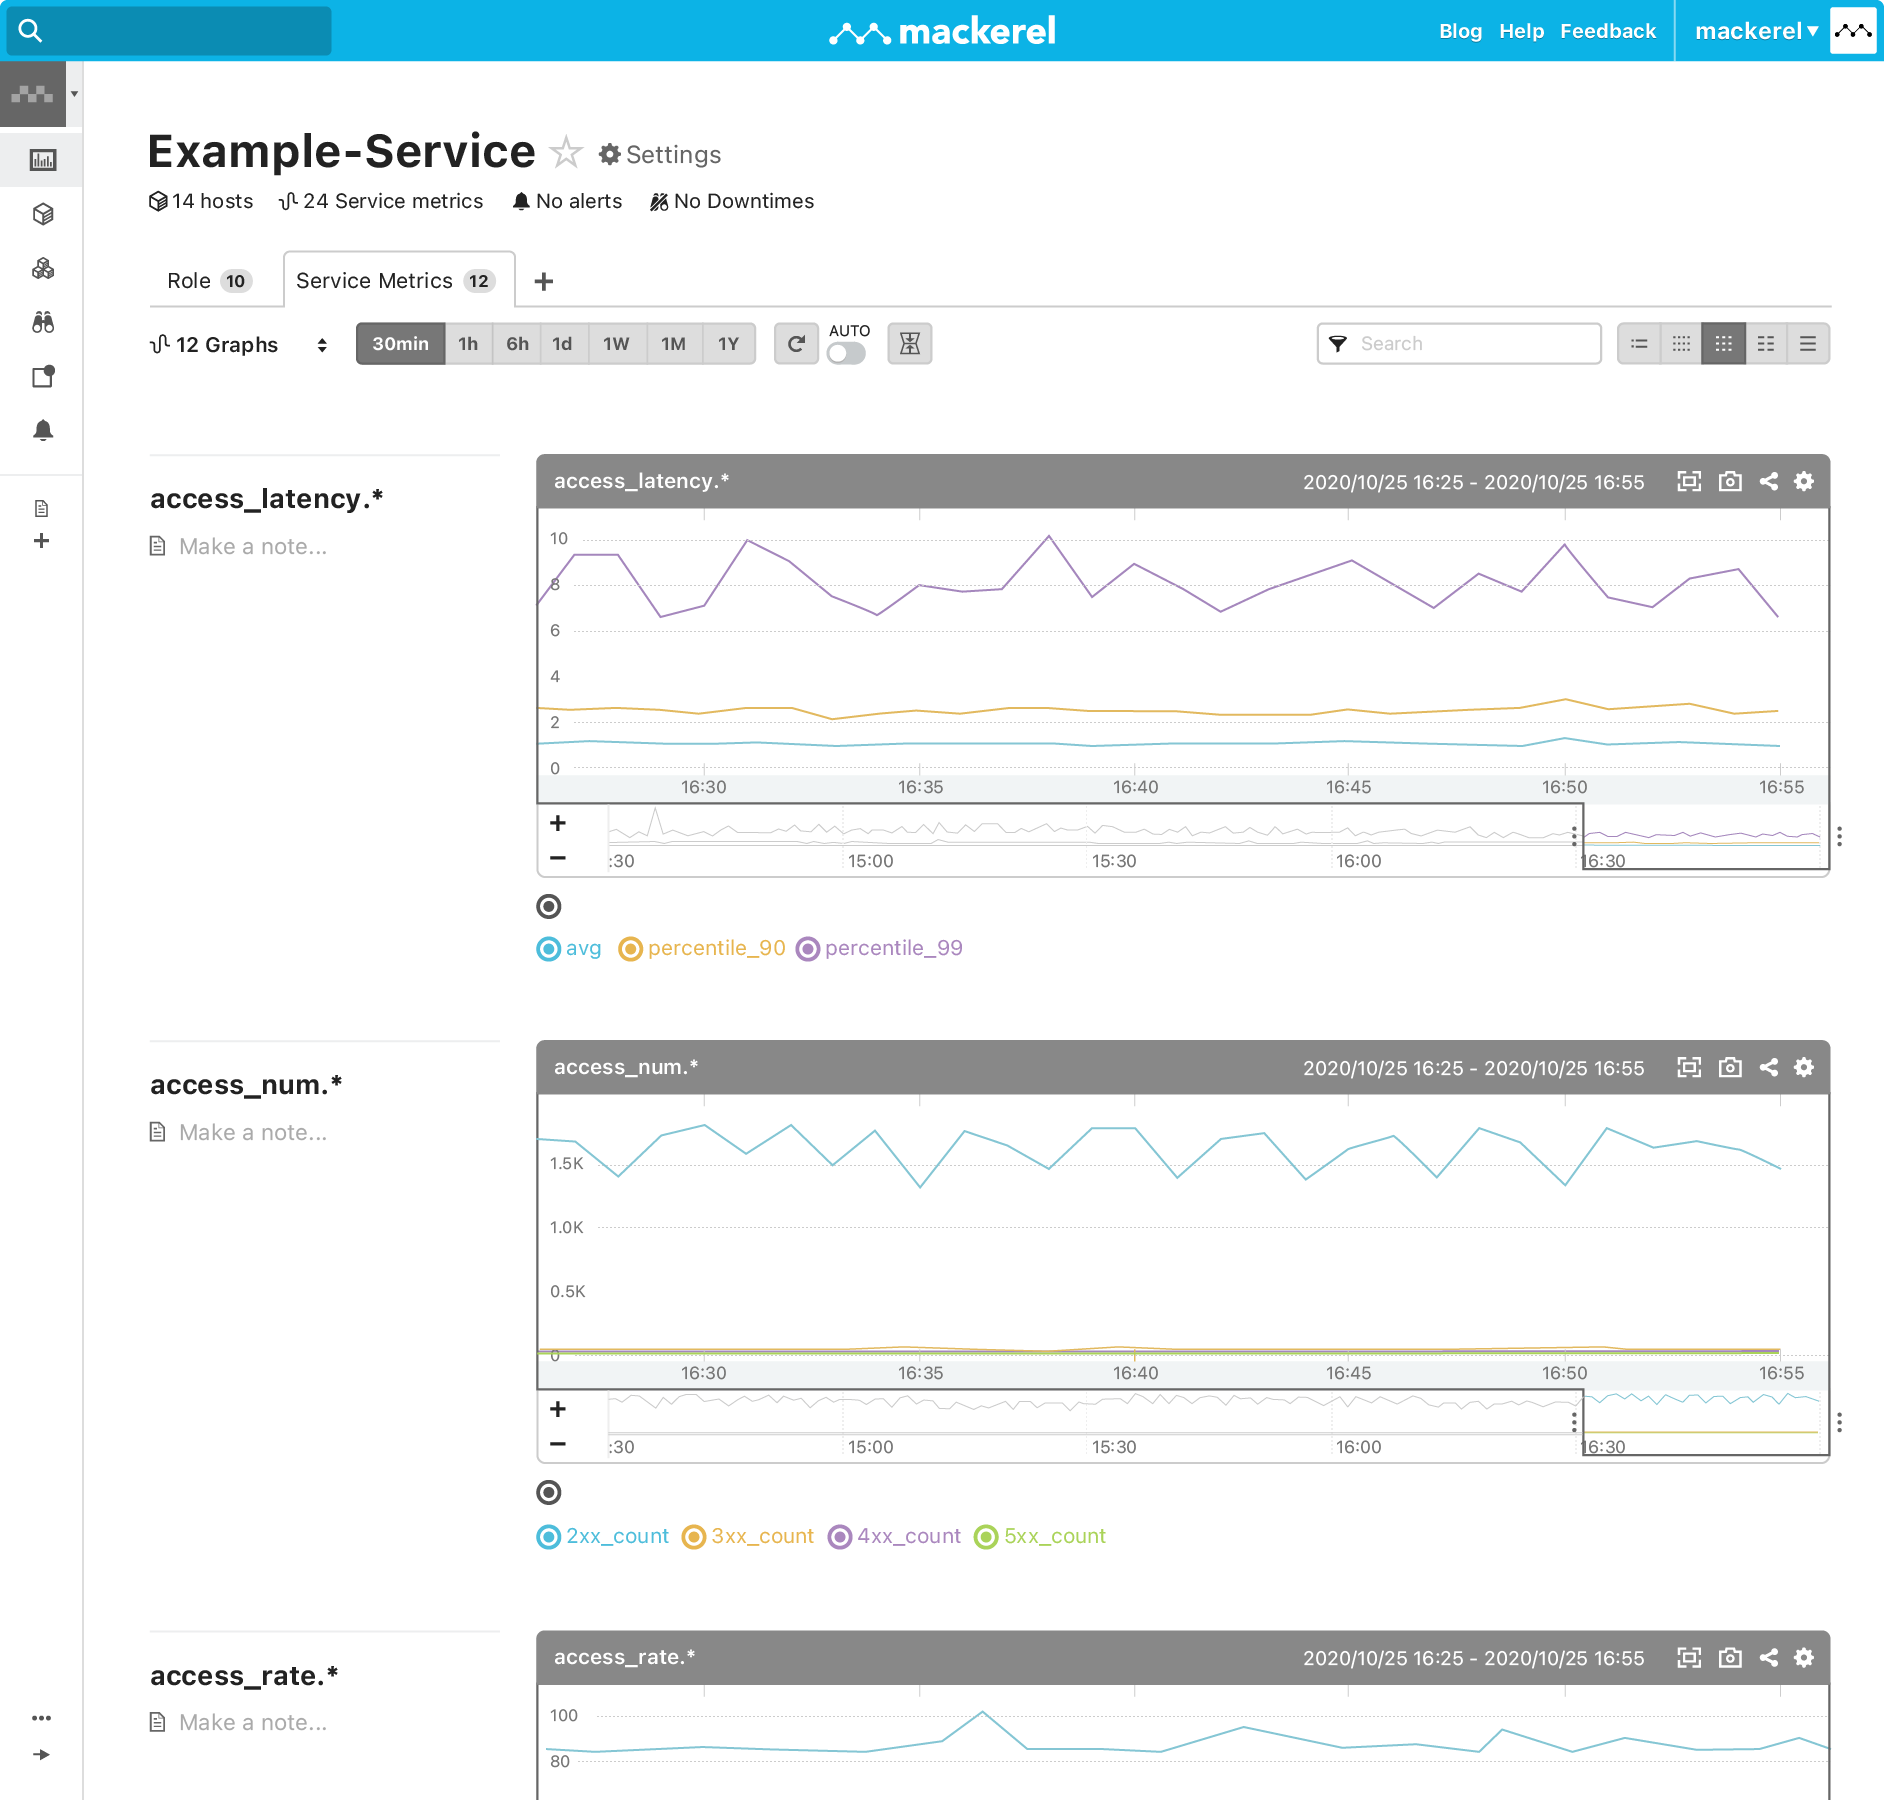
In addition to metrics that are associated with the host (host metrics), any metrics not associated with the host are considered service metrics. Register / manage various indicators based on what your team or task requires, such as a web service's response time, net sales, page views (PV) / unique users (UU), users of a specific segment, etc. Posting service metrics is easy with the RESTful API.
Features
Why choose Mackerel?
-

Overwhelmingly Simple Installation
Simply install the monitoring agent on your server and you're ready to start monitoring.
See details -

Full-fledged Monitoring
The ability to integrate various communication tools promotes information sharing within teams and creates an opportunity to foster monitoring based on the state of the system.
See details -

Advanced Monitoring
Take advantage of advanced functions such as combining multiple metrics, monitoring predicted values, and using machine learning to detect anomalies that deviate from past trends.
See details -

Multi-cloud and Containers
Centrally manage various infrastructure environments such as containers and the cloud.
See details -

Customize and Automate
Use plugins to support environment compatability. Plugins are made available as OSS and can be expanded to match unique environments.
See Details